|
MAIN PAGE
> Back to contents
Arctic and Antarctica
Reference:
Tentyukov M.P., Vasil'chuk Y.K., Mikhailov V.I., Simonenkov D.V., Gavrilov R.Y.
Features of the mechanism of aerosol fractionation in solid hydrometeors
// Arctic and Antarctica.
2023. № 3.
P. 1-15.
DOI: 10.7256/2453-8922.2023.3.43420 EDN: VOUHLS URL: https://en.nbpublish.com/library_read_article.php?id=43420
Features of the mechanism of aerosol fractionation in solid hydrometeors
Tentyukov Mikhail Panteleimonovich
ORCID: 0000-0001-8462-4408
Professor, Department of Ecology and Geology, Syktyvkar State University named after Pitirim Sorokin
167001, Russia, Komi Republic, Syktyvkar, Petrozavodskaya str., 12, room 225

|
tentukov@yandex.ru
|
|
 |
Vasil'chuk Yurii Kirillovich
ORCID: 0000-0001-5847-5568
Doctor of Geology and Mineralogy
Professor, Department of Landscape Geochemistry and Soil Geography, Faculty of Geography, Lomonosov Moscow State University
119991, Russia, Moscow region, Leninskie Gory, Leninskie Gory str., 1, of. 2009
|
|
vasilch_geo@mail.ru
|
|
 |
Mikhailov Vasilii Igorevich
PhD in Chemistry
Senior Researcher, Institute of Chemistry, Federal Research Center, Komi Scientific Center, Ural Branch of the Russian Academy of Sciences
167000, Russia, Syktyvkar, Pervomayskaya str., 48
|
|
system14@rambler.ru
|
|
 |
Simonenkov Denis Valentinovich
PhD in Physics and Mathematics
Senior Researcher, Institute of Atmospheric Optics, Siberian Branch of the Russian Academy of Sciences
634055, Russia, Tomsk, ul. Akademika Zueva Square, 1
|
|
simon@iao.ru
|
|
 |
|
Gavrilov Roman Yur'evich
PhD in Geology and Mineralogy
Associate Professor, Department of Geology and Exploration of Mineral Resources, Tomsk Polytechnic University; Department of Geology, School of Natural Resources Engineering
634050, Russia, Tomsk, Lenin Ave., 30
|
|
gavrilovroman9@mail.ru
|
|
 |
|
DOI: 10.7256/2453-8922.2023.3.43420
EDN: VOUHLS
Received:
24-06-2023
Published:
19-10-2023
Abstract:
The object of the study is the dispersed fractions of an aerosol substance in the snow cover. At the sampling sites located in the middle taiga zone within the Mezen-Vychegoda Plain on a high terrace in the Sysola river valley, 3 km west of the city of Syktyvkar, fresh snow and surface frost were sampled. The analysis of the ratios in the surface hoarfrost of subdispersed fractions of the aerosol substance was carried out in conjunction with the granulometric analysis of freshly fallen snow. Studies using the method of dynamic light scattering of the granulometric composition of an aerosol substance in freshly fallen snow and surface hoarfrost formed between snowfalls showed that a bimodal distribution of particles is recorded in all snow samples. At the same time, the distribution of submicron aerosol particles in frost samples is already characterized by the presence of three modes. Also, with an increase in the duration of the period between snowfalls in hoarfrost samples, a redistribution of particles between fine and medium fractions is observed in the direction of a significant increase in particles in the fine fraction, but the volume concentration of particles of the large fraction changes slightly. It is assumed that the identified circumstance is associated with the action of capillary forces and the adhesion of dry precipitation during the crystal formation of hoarfrost (it is proposed to call this phenomenon "frosty condensation"). A similar effect was also observed in the West Siberian southern taiga and the coastal tundra of the Lower Pechora region.
Keywords:
adhesion, aerosols, granulometry, dynamic light scattering, rime, snow, solid hydrometeors, snowfall, snow pollution, aerosol fractionation
This article is automatically translated.
You can find original text of the article here.
Introduction Currently, an ever-increasing volume of dust-aerosol mass in the troposphere is being recorded, which has more than doubled over the past century [1]. The situation is complicated by the fact that the development of production activities is accompanied by the emergence of new non-natural sources of aerosol. And if the share of anthropogenic aerosol accounts for more than 10% of all aerosol particles [2], then in industrial centers it already increases to 45%. It is also noted that anthropogenic aerosol is characterized by significant variability and heterogeneity in both chemical [3] and dispersed composition [4, 5]. Aerosol particles can stay in the atmosphere for a long time and be transported over considerable distances. Submicron atmospheric particles with a diameter of 0.001–10.0 microns play a certain role in this process. Particles representing the greatest hygienic danger (up to 0.3 microns) fall into this interval [6]. They are characterized by the fact that they are practically not captured by raindrops (cit. According to [7], p. 6). In this regard, the study of the granulometric composition of an aerosol substance is of interest. In the modern practice of analyzing the ratio of particle sizes in fine media in the nano-, micrometric range, the method of dynamic light scattering (DRS) is widely used. The physical essence of the DRS method is to register temporary fluctuations in the intensity of scattering of a laser beam in a dispersed medium. In it, due to the Brownian motion of particles, fluctuations of local concentrations of particles and associated local changes in the optical density of the dispersed medium occur, as well as changes in the refractive indices of light associated with them. The latter is due to the fact that when a laser beam passes through local concentrations of particles, light scattering occurs. It is established that the numerical parameters of light scattering depend on the particle size, particle diffusion rate and fluid viscosity [8]. DRS refers to non-destructive research methods, besides it does not require preliminary calibration. It is equally effective both at low concentrations of particles and in the presence of their aggregates. The measured particle size ranges from 0.5 nm to several microns. The method allows for very fast analysis. It is characterized by low cost of measurements and low error. Granulometric measurements of a dispersed substance are well represented in materials science[9], in engineering and construction practice in the development of composite mixtures [0], as well as in industrial control of micro-, nanopowders and suspensions [1] and in pharmaceuticals in the preparation of medicinal substances[12]. In snow science, laser granulometry is little represented. It is known that the DRS method is used in the study of the material composition of freshly fallen snow within urbanized territories [13, 14], sometimes the method acts as an additional element in the examination of the snow cover of background taiga landscapes [15]. What is common to all these studies is that they are all related to the study of snow precipitation only. It was not possible to establish publications on the granulometry of an aerosol substance in surface frost. The purpose of this work is to study, using the method of dynamic light scattering, the distribution features of submicron fractions of aerosol matter in solid hydrometeors that differ in the conditions of formation (in freshly fallen snow and surface frost formed in between snowfalls). Materials and methods Samples of solid hydrometeors (snow and surface frost) were taken at a key site within the Botanical Garden of Syktyvkar State University ("Botsad SSU"), located in a green zone three km west of Syktyvkar, in two periods. The first covered the time from 26.02.2020 to 06.03.2020, and the second – from 23.03 to 26.03.2020. In the first period, two episodes of the formation of surface frost were recorded, while in the second – three. The time of snowfall is shown in the table. The state of the weather during the observation periods is given for the Syktyvkar weather station according to publicly available data (https://rp5.ru ) (Table 1). Table 1. Weather conditions in February-March 2020 at the key site "Botsad SSU" | Date | *t min – t max t cp | **e min – e max e cp | Wind, azimuth (points) | ***Precipitation, mm | Type of precipitation | Designation of histograms | | | I period | | 26.02.2020 | -3,7 – -0,1 -1,7 | 81 – 99 90 | Z.S-Z (0-2) | 5,6 | Rain and snow | I,a | | | 27.02.2020 | -8,5 – -2,2 -5,7 | 71 – 97 88 | Yu.Yu-Z (0–1) | 0,5 | Light snow | – | | | 28.02.2020 | -14,0 – -4,2 -7,9 | 89 – 96 94 | V.S-V (1-4) | 4,0 | Continuous snow | I,b | | | 29.02.2020 | -3,5 – -0,1 -1,6 | 88 – 99 96 | Z.Yu-Z (1–2) |
8,0 | Continuous snow | – | | | 01.03.2020 | -3,4 – -5,2 -4,3 | 72 – 89 81 | Yu-Z (3–4) | 2,3 | Heavy snow | – | | | 02.03.2020 | -6,3 – +1,2 -2,1 | 86 – 94 89 | Yu.Yu-Z (3–4) | < 0,1 | Light snow | I,in | | | 03.03.2020 | -1,9 – +2,5 +1,2 | 81 – 94 89 | Z.Yu-Z (1–4) | 1,4 | Heavy snow | – | | | 04.03.2020 | -10,0 – -1,8 -5,8 | 52 – 95 74 | S.S-Z (0–2) | – | – | I,g | | | 05.03.2020 | -18,7 – -2,6 -9,7 | 50 – 92 71 | calm | – | – | I,d | | | 06.03.2020 | -5,7 – +3,1 -0,7 | 60 – 95 72 | Yu.Yu-Z (3–5) | 4,3 | Rain and snow | I,e | | | II period | | 23.03.2020 | -14,3 – -0,3 -4,8 | 37 – 95 63 | Z.Yu-Z (0–2) | – | – | II,a | | | 24.03.2020 | -10,3 – +5,0 -1,0 | 28 – 82 47 | Yu.Yu-Z (0-2) | – | – | II,b | | | 25.03.2020 | -1,4 – +3,2 +0,7 | 45 – 90 69 | Yu.Yu-Z (2-3) | 0,2 | Traces of precipitation | II,in | | | 26.03.2020 | +0,9 – +6,1 +2,6 | 61 – 92 78 | Z.S-Z (1–3) | 1,4 | Snow and rain | II,g | |
*Air temperature
**Relative humidity in %. ***The values of the water equivalent of the fallen snow layer are given. Sampling of the upper layer of snow and surface frost was carried out using a special sampler. The diagram of the device (snow polygon) and an example of its use in sampling surface frost is shown in Fig. 1. It is made in the form of a square (Fig. 1, a), consisting of large horizontal (1) and small vertical (3) rectangular plates, perpendicular to the larger edge. The rigidity of the fasteners is provided by two triangular plates (2). On the lower side of the horizontal plate (1) of the snowmobile there are two guides in the form of a groove (4) for a knife tray. The knife-tray (Fig. 1, b) is made in the form of a rectangular box without a front wall, with a pointed outer edge of the base, in the upper part on the outside of the side walls there are two guides in the form of protrusions (5). The knife-tray is equipped with a handle (6) fixed on the back wall.
To sample the top layer of snow or surface frost, the snowmobile is immersed in snow until its horizontal plate reaches the snow surface without touching it. Then, along the front edge of the snow polygon, a shallow snow pit is torn off, one wall of which coincides with the front edge of the horizontal plate of the snow polygon. After that, a knife-tray is inserted into the guides of the horizontal plate (with a height of 18 mm with a width of 27 cm and a length of 36) and pushed into the snow wall of the pit (Fig. 1, c). The snow briquette obtained in this way with a volume of 1750 cm3 was placed in a plastic bag in which the sample was thawed at room temperature. 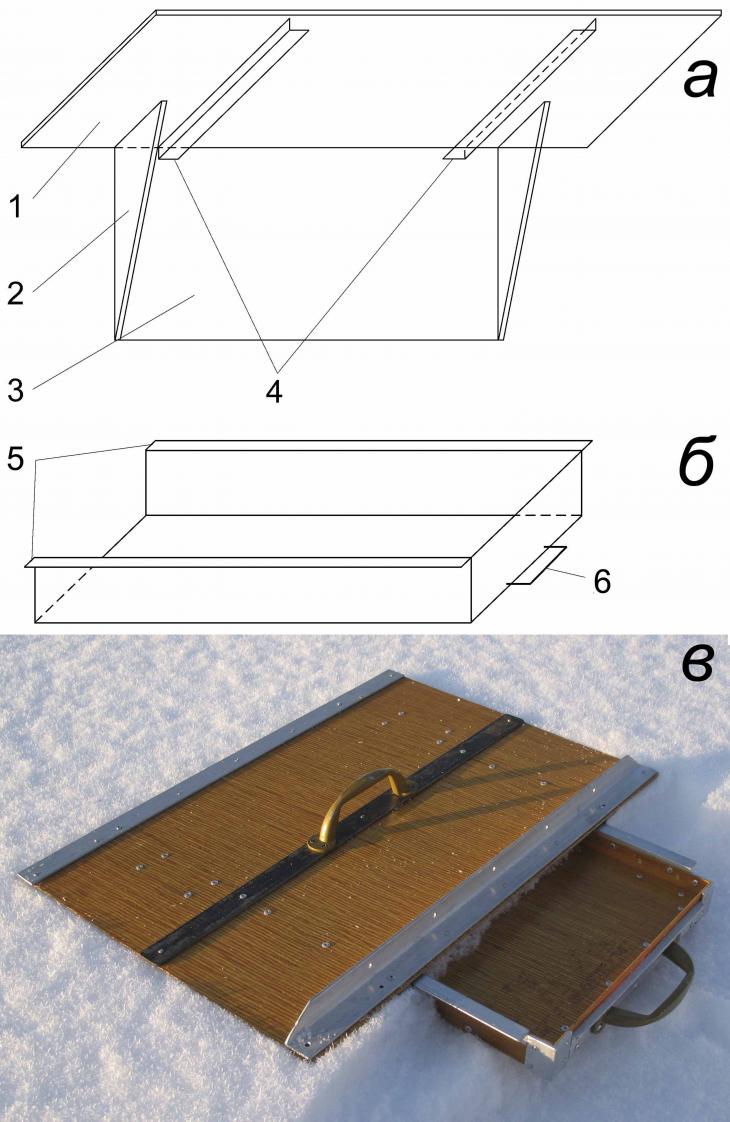
Fig. 1. Device (snow polygon) for sampling surface samples of snow and surface frost (a – square, b – knife-tray) and an example of its use (c): a) 1, 2, 3 – plates of the snow polygon, 4 – guide slots for the knife-tray; b) 5 – guides in the form of protrusions for movable fixation of the knife-tray with the upper plate of the snowmobile, 6 – handle of the knife-tray Figure 1. A device (a snow angle) for surface snow sampling (a - an angle, b - a knife-tray) and an example of its use (c). Legend: a) 1, 2, 3 - plates of angle, 4 - guide grooves for the knife-tray; b) 5 - guides in the form of protrusions for the knife-tray movable fixation with the upper plate of the angle, 6 - a knife-tray handle It should be noted that the density of surface frost is very low and ranges from 0.02 to 0.04 g/cm3. Therefore, in order to gain the necessary volume for one sample sufficient, for example, for hydrochemical analysis, the operation should be repeated 11 times. Figure 2 shows the site where surface frost is sampled for subsequent determination of polycyclic aromatic hydrocarbons in it. 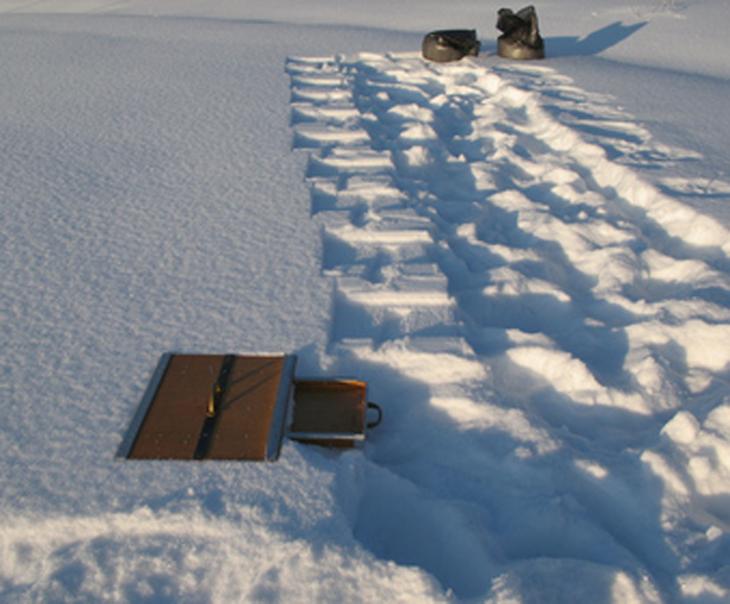
Fig. 2. Sampling of surface frost for hydrochemical analysis (explanation in the text) Figure 2. Sampling of surface frost for hydrochemical analysis (explanation in the text) Meanwhile, to perform a granulometric analysis, the required volume of snow water was only 50 ml. To characterize the particle sizes in the samples, a laser analyzer ZetaSizer Nano ZS (Malvern Analytical, UK) was used. The particle size measurement range is from 1 to 10000 nm. For each sample, six measurements of the average volume diameter of the particles (D cf., nm) (the average diameter according to the volume distribution of particles) were carried out. For each measurement, the optimal accumulation time of the correlation function was determined automatically by the software of the device. After that, their averaging was carried out. The ratio of particle sizes is shown in the form of distribution histograms (Fig. 3), which have a number of maxima, each of which reflects the volume content of particle fractions. The volume content of particle fractions in the samples is calculated integrally by the ratio (%) of the area of the figures describing the particle size distribution data in linear coordinates. 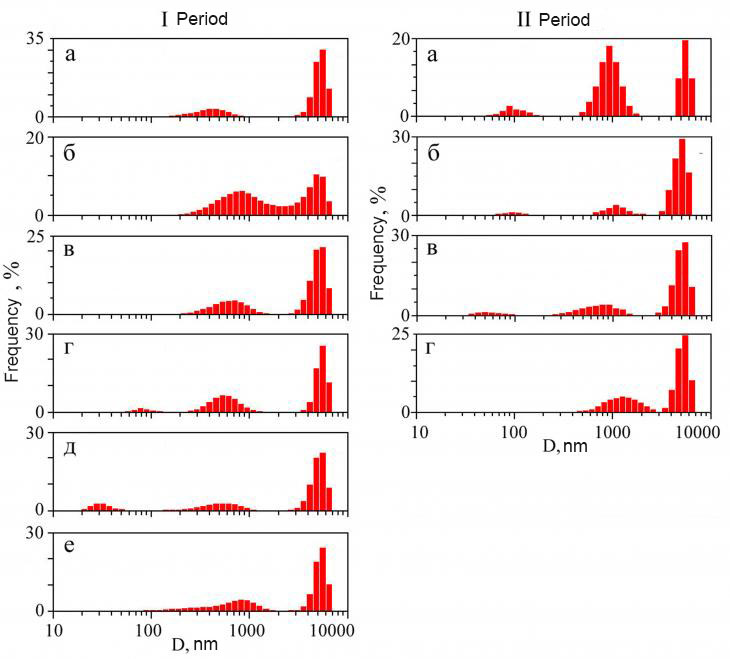
Fig. 3. Frequency distribution of aerosol particles by size in different observation periods: in snow precipitation (I,a, I, b, I,c, I,e, II, d) and surface frost (I,g, I, d, II, a, IIb, II,b) Figure 3. Frequency distribution of aerosol particles by size in different observation periods: in snow precipitation (I,a, I,b, I,c, I,e, II,d) and surface frost (I,d, I,e, II ,a, IIb, II, c) Results and discussion Frequency distribution of particles by size in freshly fallen snow. During the observations, five such samples were obtained, of which four were taken in the first period and one in the second. In the first sample taken on 02/26/2020, the particle distribution is bimodal (Fig. 3, I,a) with significant dispersion and reflects the presence of two aggregates (fractions). The first with a mode of 447 ± 166 nm is fixed in the range of 200-1000 nm, while the second with a mode value of 5144 ± 780 nm and separated from the first by a wide gap lies in a narrow range (3000-7000 nm) with a well-defined peak in the region of 5000-6000 nm. The fraction ratio is dominated by the proportion of large particles (78% vs. 22). The second sampling was performed on 02/28/2020. The distribution of particles in the second sample reflects two aggregates (Fig. 3, I, b). For the first mode value is 694 ± 268 nm, and for the second – 4996 ± 851 nm. The shares of the first and second fractions are 57 and 43%, respectively. It should be noted that in this layer, formed under conditions of continuous snowfall, there was no formation of isolated fractions, as in the previous case. Then it rained with sleet during sampling. The third sampling was made on 02.03.2020 . The accumulation of the layer took place in conditions of light snowfall, which began the day before. The particle size distribution, as in the previous samples of freshly fallen snow, is bimodal (Fig. 3, I, c). The first aggregate is allocated in the range of 200-1500 nm with a mode of 642 ± 233 nm, while the second lies in the range from 3000 to 7000 nm with a mode of 4997 ± 862 nm. In the ratio of fractions, the proportion of large particles is greater than small ones (65% and 35, respectively). The fourth sampling of freshly fallen snow was carried out on 06.03.2020. It was wet snow with rain. The distribution of particles in the fourth sample clearly reflects two aggregates (Fig. 3, I, e). The first lies in the range of 150-2000 nm with a mode of 639 ± 350 nm, and the second – 3500-7000 nm with a mode of 5067 ± 821 nm. The fraction ratio is strongly dominated by the proportion of large particles (75% vs. 25). The fifth sampling of freshly fallen snow was made on 26.03.2020. The nature of precipitation is heavy snow with rain. The particle size distribution is bimodal (Fig. 3, II, d). The first aggregate is allocated in the range of 400-3000 nm with a mode of 2100 ± 742 nm, while the second lies in the range from 3000 to 7000 nm with a mode of 5111 ± 817 nm. In the ratio of fractions, the proportion of small ones is slightly higher (54% and 46, respectively). In general, it can be noted that there are common features in the nature of particle size distribution in all samples of freshly fallen snow. Firstly, a bimodal distribution of particles is recorded in all samples due to the presence of two aggregates. Secondly, in the particle size distribution, there is a stable binding of aggregates to certain intervals of the dimensional scale. One is recorded in the range of 200-3000 nm, and the other – 3000-7000. Thirdly, the proportion of large particles (3000-7000 nm) steadily prevails in the analyzed samples, which increases in conditions of wet snow and rain.
The frequency distribution of particles by size in the surface frost formed during the break between snowfalls. During the observations, five such samples were obtained, of which two were taken in the first period and three in the second. The first frost sampling was performed on 03/04/2020. The particle distribution is characterized by significant dispersion and reflects the presence of three fractions (Fig. 3, I, d). The first is fixed in the range of 40-120 nm with a mode of 99 ± 23, the second is separated from the first by a small gap and is located in the region of 250-1200 nm with a mode of 658 ± 234. The third set with a large gap is separated from the second and lies in a narrow range of 3000-7000 nm with a mode of 5216 ± 748. The shares of the three fractions are 1, 33 and 66%, respectively. The second sampling of surface frost was carried out on 05.03.2020. The particle distribution is three-modal with significant dispersion and reflects the presence of three aggregates (Fig. 3, I, d). The particle size range for the first fraction is from 20 to 50 nm with a mode of 32±7. The second is separated from the first by a large gap, while occupying an interval of 200-1000 with a mode of 567 ± 210 nm. The third set is separated from the second by a wide gap and lies in the range of particle sizes from 3000 to 7000 nm with a mode of 4958± 875. The ratio of the shares of the first, second and third fractions is 23, 11 and 66%, respectively. The third sampling of surface frost was carried out on 03/23/2020. The particle distribution is three-modal (Fig. 3, II,a) with significant dispersion and reflects the presence of three fractions. The first is fixed in the range of 50-120 nm with a mode of 100 ± 24, the second is separated from the first by a small gap and is located in the region of 450-1200 nm with a mode of 908 ± 239. The third set is also separated from the second one with a gap and lies in a narrow range of 4500-7000 nm with a mode of 5590 ±579. The shares of the three fractions are 5, 65 and 30%, respectively. The fourth sampling of surface frost was carried out on 03/24/2020. The distribution of particles reflects the presence of three aggregates, which, unlike previous samples, are somewhat shifted to the region of small values (Fig. 3, II, b). The particle size range for the first fraction is from 15 to 50 nm with a mode of 39±7. The second lies in the range of 50-200 with a mode of 93 ± 23 nm. The third set is separated from the second by a gap and is located in the range of particle sizes from 500 to 1500 nm with a mode of 859 ± 161. The ratio of the shares of the first, second and third fractions is 20, 12 and 68%, respectively. The fifth frost sampling was carried out on 25.03.2020. The particle size distribution, as in the previous frost samples, is three-modal (Fig. 3, II, b). The first set is allocated in the range of 20-100 nm with a mode of 60 ± 17. The second is separated from the first by a small gap and lies in the range from 250 to 1500 nm with a mode of 712 ± 265. The third set is fixed in the range of 2500-7000 nm with a mode of 5129 ± 796. The fraction ratio is strongly dominated by the proportion of large particles (78% versus 19 medium and 3 small). If we compare the obtained values with the data on snow precipitation, we can see that in both observation periods, in addition to two collections of particles with submicron sizes, a third belonging to the group of highly dispersed (colloidal) particles is recorded in the frost samples. With an increase in the duration of the period between snowfalls in frost samples, a redistribution of particles between small and medium fractions is observed in the direction of a significant increase in fine, while the volume content of large fraction particles changes little. At the same time, the range of particle sizes in the third fraction decreased from 40-120 nm to 20-50. The mechanism of removal of a fine aerosol substance from the surface air. It is assumed that the revealed differences in the distribution of submicron fractions of aerosol substance in the layer of freshly fallen snow and surface frost formed in the intervals between snowfalls are due to differences in the mechanism of their formation. It is known that the snow cover emits its own heat (even at the lowest temperature) in the form of long-wave radiation. In addition, the snow cover has a high ability to reflect solar radiation. This contributes to its strong cooling and the occurrence of temperature inversion.[16] Along with this, the snow cover has a drying effect on the surface layer of air[17]. In the presence of a temperature and humidity gradient, the snow cover initiates a downward steady mass transfer of water vapor, entrapping aerosol particles from the surface air layer towards the snow cover. And since the saturated vapor pressure above the snow-covered surface is always less than in the surface layer of air, this serves as an additional factor in enhancing the mass transfer of water vapor towards the snow cover and activating the flow of fine aerosol particles from the surface atmosphere. At the same time, the mechanism of frosty concentration of aerosol substance on the snow surface is carried out due to the action of molecular forces such as Vandervaals (adhesion, capillary condensation, physical adsorption). When dispersed aerosol particles come into contact with the surface, a layer of capillary moisture appears between them, which is formed due to condensation of vapors into a liquid at a pressure that is less than the pressure of saturated vapor. Observations of the formation of Aitken particles in the Wilson chamber showed[18] that the manifestation of capillary fluid is already fixed at a relative humidity of 50%. It is associated with the action of capillary forces and the manifestation of particle adhesion.[19] In this case, adhesion is always preceded by adsorption, which, in turn, is accompanied by a change in the concentration of the substance at the phase interface. It is noted that the process takes place on various interphase surfaces and any substances can be adsorbed. The mechanism of condensation of aerosol substance in solid hydrometeors. It is known that atmospheric ice can also occur when water vapor condenses on the surface of mineral nanoparticles.[20,21] Condensation liquid in the form of accumulations (islands) of film moisture accumulates in the inhomogeneities of the surface of nanoparticles at relative humidity below 80%. At the same time, it is noted that an increase in the thickness of the film moisture in such inhomogeneities is possible even under conditions of undersaturation.[22] Then, if we take into account this circumstance, as well as the results of X's experiments.It can be assumed that the accumulation of aerosol substance during the crystallization of surface frost is possible in a wide range of relative humidity values (from 50% to <80). Meanwhile, studies of the thermodynamics of microparticles have shown that the particle size can be considered as equivalent to temperature; its size is an active variable that determines, along with other thermodynamic variables, the state of the system and its reactivity (increase in solubility, shift in chemical equilibrium).[22] Consequently, with an increase in the degree of dispersion of the aerosol substance, its solubility in interaction with cloud droplets will increase.
it is accompanied by an active runoff of "dry" aerosol substance. This process, starting in the atmosphere in a wide range of unsaturation of relative humidity (from 50% to <80), continues on the snow surface with the formation of ice crystals of surface frost, which is accompanied by the accumulation of dry aerosols in them. By the way, this explains the previously established well-known fact about the higher content of pollutants in frost than in snow.[23-26] Thus, the frost crystallizing on the snow surface can serve as an object of testing when detecting atmospheric contamination of the snow surface, in the intervals between snowfalls. At the same time, it should be noted that it was not possible to detect any connection between the different morphological forms of frost ice crystals and the ratio of the subdisperse fractions of the aerosol substance. It is possible that they may manifest themselves in a comparative study of their chemical composition. However, this assumption requires additional verification. In general, it can be noted that for territories with a cold climate, including Arctic regions, characterized by the presence of a long period with a stable snow cover, frosty condensation of technogenic aerosols can be the main source of aerotechnogenic pollution of the snow cover between snowfalls. Conclusion Studies of the granulometric composition of aerosol substance in solid hydrometeors performed using the method of dynamic light scattering, which differed in the mechanism of formation (freshly fallen snow and surface frost formed in between snowfalls) showed that bimodal particle distribution is recorded in all samples of freshly fallen snow. It was also noted that the proportion of large particles (3000-7000 nm) steadily prevails in them, which increases in conditions of wet snow with rain. In the samples of surface frost, the presence of three aggregates is steadily recorded. At the same time, it is important to note that with an increase in the duration of the period between snowfalls, a redistribution of particles between fine and medium fractions is observed in the samples of frost towards a significant increase in fine, while the volume content of particles of a large fraction changes little. The appearance of the third fraction of the aerosol substance in the surface frost is associated with the peculiarities of the mechanism of removal of fine aerosol substance from the surface air in the intervals between snowfalls, and their accumulation is due to the peculiarities of the manifestation of the action of capillary forces and particle adhesion during the crystallization of frost (we propose to call this effect frost condensation). The mechanism of frost condensation is due to the fact that the snow cover causes the cooling and drying of the snow-covered air layer. As a result, a temperature and humidity gradient appears above the snow surface. This, in turn, initiates a downward steady mass transfer of water vapor, entrapping aerosol particles from the surface layer of air towards the snow cover. At the same time, the contact of aerosol particles with the surface of growing ice crystals of surface frost is carried out due to the action of molecular forces such as Vandervaals (adhesion, capillary condensation, physical adsorption). The manifestation of frost condensation is possible at lower values of relative humidity (from 50% to <80) than is required for snowfall (from 80 to 100%). Moreover, circumstances favorable for the crystallization of surface frost occur more often than for snowfall. Consequently, the frost formed on the snow surface can serve as an object of testing when detecting dust-aerosol contamination of snow in the intervals between snowfalls. It should be noted that the considered mechanism of aerosol fractionation in solid hydrometeors is equally manifested in the conditions of the southern taiga of Western Siberia (the Tomsk interfluve, the key sites in the observatory "Background" and at the scientific landfill in the suburbs of Tomsk - "Large Experimental Complex" – BEC), and within the middle Taiga zone of the Mezen–Vychegod plain (the key site of "Botsad SGU" in the green suburban area of Syktyvkar), and in the coastal tundra of the Lower Pripechorye (key areas within the R.Trebs oil field, Bolshezemelskaya tundra).
References
1. Mahowald, N. M., Kloster, S., Engelstaedter, S., Moore, J. K., Mukhopadhyay, S., McConnell, J. R., Albani, S., Doney, S. C., Bhattacharya, A., Curran, M. A. J., Flanner, M. G., Hoffman, F. M., Lawrence, D. M., Lindsay, K., Mayewski, P. A., Neff, J., Rothenberg, D., Thomas, E., Thornton, P. E., & Zender, C. S. (2010). Observed 20th century desert dust variability: impact on climate and biogeochemistry. Atmos. Chem. Phys., 10, 10875–10893. Retrieved from https://doi.org/10.5194/acp-10-10875-2010
2. Ivlev, L. S. (2011). Aerosol impact on climatic processes. Atmospheric and Oceanic Optics, 24(5), 392–410.
3. Yermakov, A.N., Larin, I.K., Ugarov, A.A., &Purmal', A.P. (2003). On catalysis of iron and SO2 oxidation in the atmosphere. Kinetics and Catalysis, 44(4), 524–537.
4. Gershenzon, Yu.M., & Purmal', A.P. (1990). Heterogeneous processes in the earth's atmosphere and their ecological consequences. Uspekhi khimii, 59(11), 1729–1756.
5. Kondrat'yev, K.Ya. (2006). Aerosol and climate: current state and development prospects. 1. Formation, properties of aerosol and their transformation. Atmospheric and Oceanic Optics, 19(1), 5–22.
6. Sayet, Yu.Ye., Revich, B.A., Yanin, Ye.P., Smirnova, R.S., Barashkevich, I.L., Onishchenko, T.L., Pavlova, L.N., Trefilova, N.Ya, Achkasov, A.I., & Sarkisyan, S.Sh. (1990). Geochemistry of the environment. Moscow: Nedra.
7. Veremey, N.Ye., Dovgalyuk, Yu.A., Yegorov, A.D., Ishchenko, M.A., Ponomarev, Yu.F., Sin'kevich, A.A., Stalevich, D.D., Stepanenko, V.D., & Khvorostovskiy, K.S. (1999). Investigation of wet washout of aerosol particles by clouds and precipitation. Meteorology and Hydrology, 8, 5–13.
8. Berne, B.J., & Pecora R. (1976). Dynamic Light Scattering. John Wiley and Sons Ltd. Retrieved from https://doi.org/10.1002/bbpc.19770810123
9. Selyayev, V.P., & Neverov, V.A. (2013). Innovative education. Publishing house of the National. State. un-t, Saransk.
10. Kharkhardin, A.N., Suleymanova, L.A., & Strokova, V.V. (2012). Topological properties of polydisperse mixtures and their constituent fractions according to the results of sieve and laser analysis of granulometry. Izvestiya vuzov. Construction, 11–12, 114–124.
11. Kochegarov, I.I., Trusov, V.A., & Yurkov, N.K. (2010). Methods for controlling dispersed powders. Proceedings of the International Symposium "Reliability and Quality". Publishing house of the Penza SU, 2, 475–477. Penza.
12. Yeshmanova, S.V. (2009). Pharmaceutical technologies and packaging. Medicines according to GMP. Retrieved from http://medbusinesss.ru/365.php/
13. Golokhvast, K.S., Soboleva, Ye.V., Nikiforov, P.A., Khristoforova, & N.K., Gul'kov, A.N. (2012). Analysis of nano- and microparticles in the snow of Ussuriysk. Water: chemistry and ecology, 11(53), 108–112.
14. Golokhvast, K.S., Revutskaya, K.S., Lonkina, Ye.S., Nikiforov, P.A., Gul'kov, A.N., & Khristoforova, N.K. (2013). Granulometric analysis of suspended particles in the snow of Birobidzhan and the state reserve “Bastak”. Water: chemistry and ecology, 2(56), 116–123.
15. Vasilevich, M.I., Vasilevich, R.S., Mikhaylov, V.I., & Krivoshapkin, P.V. (2017). Assessment of the properties of atmospheric suspensions in the snow of the background territories of the taiga zone of the European northeast of Russia. Atmospheric and Oceanic Optics, 30(2), 184–190.
16. Rikhter, G.D. (1945). Snow cover, its formation and properties. Moscow: Publishing house of the Academy of Sciences of the USSR.
17. Rikhter, G.D. (1948) The role of snow cover in the physical-geographical process. Proceedings of the Institute of Geography, USSR Academy of Sciences. Issue 40. M.-L.: Publishing house of the Academy of Sciences of the USSR.
18. Junge, H. (1965). Chemical composition and radioactivity of the atmosphere. Moscow: Mir.
19. Cort, A., & Scot T.M. (2001). Atmospheric nanoparticles. Rev. Mineral. Geochem, 44(1), 293–349. doi:10.2138/rmg.2001.44.08
20. Zimon, A.D. (1983). What is adhesion. Moscow: Nauka.
21. Golubev, V.N. (2015). The role of aerosol particles in the nucleation of atmospheric ice. Meteorology and Hydrology, 12, 19–28.
22. Yushkin, N.P. (2005). Ultra- and microdisperse state of mineral matter and problems of nanomineralogy. Nanomineralogy, 10–61. St. Petersburg: Nauka.
23. Berg, N., Dunn, P., & Fenn, M. (1991). Spatial and temporal variability of rime ice and snow chemistry at five sites in California. Atmospheric Environment. Part A. General Topics, 25(5-6), 915-926. Retrieved from https://doi.org/10.1016/0960-1686(91)90134-S
24. Saxena, V.K., Yeh, & R.J.-Y. (1988). Temporal variability in cloud water acidity: Physico-chemical characteristics of atmospheric aerosols and windfield. J. Aerosol Science, 19(1), 1207-1210. Retrieved from https://doi.org/10.1016/0021-8502(88)90137-1
25. Borys, R., Hindman, E.E., & DeMott, P.J. (1988) The chemical fractionation of atmospheric aerosol as a result of snow crystal formation and growth. Atmospheric Chemistry, 7, 213–239. Retrieved from https://doi.org/10.1007/BF00130931
26. Hůnová, I., Novák, M., Kurfürst, P., Škáchová, H., Přechová, E., Komárek, A., Čuřík, J., Veselovský, F., & Bohdálková, L. (2022). Contribution of rime to atmospheric sulphur deposition in Central Europe: A combined empirical and modelling approach. Atmospheric Environment, 270(1), 118877. Retrieved from https://doi.org/10.1016/j.atmosenv.2021.118877
Peer Review
Peer reviewers' evaluations remain confidential and are not disclosed to the public. Only external reviews, authorized for publication by the article's author(s), are made public. Typically, these final reviews are conducted after the manuscript's revision. Adhering to our double-blind review policy, the reviewer's identity is kept confidential.
The list of publisher reviewers can be found here.
The subject of the study is, in the author's opinion, the patterns and features of the mechanism of fractionation of aerosol matter in solid hydrometeors. The methodology of the study, the article indicates the use of field methods, sampling of solid hydrometeors (snow and surface frost) with the determination of the range of size of granular particles in frozen rocks in laboratory work, as well as the analysis of literary data. Sampling from the upper layer of snow and surface frost was performed using a special sampler, and a laser analyzer was used to characterize the particle sizes. The weather condition of the author during the observation periods was analyzed according to publicly available data, while air temperature, volume and nature of precipitation, wind strength and direction were analyzed. Judging by the illustrative material, the author undertook expeditionary field research methods, followed by desk processing. The relevance of the topic is indisputable, as an increase in the volume of dust and aerosol mass is recorded in the troposphere, which has more than doubled over the past century. The considered mechanism of aerosol fractionation in solid hydrometeors is equally manifested in the conditions of the southern taiga of Western Siberia and within the Middle taiga zone of the Mezen-Vychegod plain and in the coastal tundra of the Lower Pripechorye. In this regard, the study of the mechanism of precipitation of solid meteors in the form of frost in the absence of snowfall is a universal mechanism for capturing and absorbing solid dust particles on the surface, which ensures self-purification of the atmosphere. The scientific novelty lies in the author's attempt to study, using the method of dynamic light scattering, the distribution features of submicron fractions of aerosol matter in solid hydrometeors, which differ in the conditions of formation in freshly fallen snow and surface frost formed between snowfalls. This is an important addition in the development of geocryology. Style, structure, content the style of presentation of the results is quite scientific. The article is provided with rich illustrative material reflecting the process of ice formation in the soil. Of the directions given by the author, a particularly interesting point should be noted: favorable conditions for the crystallization of surface frost occur more often than for snowfall. Therefore, frost on the snow surface can serve as an object of testing when detecting dust and aerosol contamination of snow within the continuous and insular cryolithozone. The article contains a variety of interesting illustrative material in the form of tables, figures, diagrams. The bibliography is very exhaustive for the formulation of the issue under consideration, but does not contain references to normative legal acts and methodological recommendations on the geochemical analysis of soil features. The appeal to the opponents is presented in identifying the problem at the level of available information obtained by the author as a result of the analysis. Conclusions, the interest of the readership in the conclusions there are generalizations that made it possible to apply the results obtained. The target group of information consumers is not specified in the article.
Link to this article
You can simply select and copy link from below text field.
|
|