|
MAIN PAGE
> Back to contents
Arctic and Antarctica
Reference:
Kozlov A.K., Gurulev A.A.
Features of radiothermal study of ice in the microwave range
// Arctic and Antarctica.
2023. № 3.
P. 73-85.
DOI: 10.7256/2453-8922.2023.3.43976 EDN: VIWRLS URL: https://en.nbpublish.com/library_read_article.php?id=43976
Features of radiothermal study of ice in the microwave range
Kozlov Aleksey Konstantinovich
ORCID: 0000-0002-8413-6049
Junior Researcher, Institute of Natural Resources, Ecology and Cryology SB RAS
672014, Russia, Transbaikal region, Chita, st. Nedorezova, 16a

|
aleksej.kozlov.97@mail.ru
|
|
 |
|
Gurulev Aleksandr Aleksandrovich
ORCID: 0000-0003-2232-3583
PhD in Physics and Mathematics
Senior Researcher, Institute of Natural Resources, Ecology and Cryology SB RAS
672014, Russia, Transbaikal region, Chita, st. Nedorezova, 16a
|
|
lgc255@mail.ru
|
|
 |
|
DOI: 10.7256/2453-8922.2023.3.43976
EDN: VIWRLS
Received:
07-09-2023
Published:
19-10-2023
Abstract:
The subject of the study is ice formations, which are formed as a result of the release of groundwater to the surface of ice sheets or soil. These formations cause significant damage in human economic activity. The work investigated natural ice located on fresh ice cover, as well as artificial ice formations on the ground. The glaciers located in the Transbaikal region near the city of Chita were investigated. The power of thermal radiation of these objects in the microwave range was determined at wavelengths of 2.3 cm and 0.88 cm. The power of thermal radiation in the microwave range was determined using radiometric receivers at wavelengths of 0.88 cm and 2.3 cm mounted on a car or on a fixed support. Cores of ice removed from the ice were studied to determine the layer-by-layer distribution of ice mineralization. A model of a plane-layered non-isothermal medium was used to calculate the thermal radiation of ice. The possibility of registering ice formations by radiothermal radiation of these objects in the microwave range is shown. If there is a layer of water on the ice, the radio brightness temperature will be significantly lower than the object on the surface of which there is no water mass. By the value of the radio brightness temperature in the microwave range for several ranges, as a result of which it is possible to indirectly estimate the thickness of ice formations. At the same time, it is necessary to take into account the variations in the radiofrequency temperature of the medium depending on its thickness due to the interference of radiothermal radiation of a plane-layered medium.
Keywords:
aufeis, microwave range, radiothermal radiation, remote sensing, radiometry, ice cover, ground, underground waters, radiobrightness temperature, Transbaikal region
This article is automatically translated.
You can find original text of the article here.
Introduction Ice formations, both on soils and on the ice sheets of rivers and lakes, are the result of various factors and phenomena occurring in the environment, including due to climatic changes. A strong increase in the temperature of the near-surface layer of the troposphere in the Arctic region of Russia (over the past 30 years in winter by 4 ° C, and in summer by 2.5 ° C) [1] has led to an annual increase in precipitation. In addition, there has been a significant change in the circulation of air masses in this region. As a result, the climate of the western part of the Russian Arctic has changed. As a result, in the Arctic and Subarctic zones of the Russian Federation, climatic changes in the temperature of the soil cover have also occurred. According to the regional climate data in the Russian Arctic, there is an accelerating increase in soil temperature with a simultaneous decrease in the thickness and area of snow cover in November and April [2]. For this reason, the degradation of permafrost soils also occurs [3-5], which can lead to the processes of complete destruction of the cryolithozone, as a result of which greenhouse gas emissions will be observed. In addition, the degradation of permafrost rocks will lead to catastrophic technogenic consequences, for example, to the destruction of building structures [6]. So, only, on average, about 7,400 accidents occur in the oil fields of Western Siberia per year, due to the melting of permafrost rocks [6]. Climate change in the Subarctic zone has led to an increase in ambient temperature. The Trans-Baikal Territory is no exception, where the temperature increase averages 0.29 ° C over the past ten years, moreover, in winter 0.40 ° C over the past ten years, and in summer 0.30 ° C over the same period of time [7]. The maximum increase in temperature is observed in the spring period of 0.56 ° C over the past ten years. This increase in surface air temperature leads to an increase in the temperature of the soil cover [8], and, accordingly, to the degradation of permafrost formations. In addition, there have been changes in the amount of precipitation in Transbaikalia. Since 2017, there has been an increase in precipitation in the region. And moreover, in the next decade, the trend of their increase will continue [9], which leads to an increase in the groundwater level. In connection with these climatic changes in the Subarctic zone of Russia, the number of ice has also begun to increase. This fact is well traced on the example of the Trans-Baikal Territory [10-11]. They negatively affect various engineering structures, rendering some of them unusable [12]. Also, ice significantly affects the natural environment, being a kind of ecosystem. It has a landashft-forming value, influencing the terrain, microclimate, vegetation and soil cover, etc. [13]. Thus, monitoring of ice phenomena in the Subarctic and Arctic regions is an urgent task and has great practical significance. Theoretical modeling of thermal radiation of ice Ice is formed as a result of the outpouring of natural or man-made waters on the surface of various environments, such as soils, ice sheets, etc. As a result, layered ice structures are formed [14]. This structure is visually well defined on the core of the ice removed from the ice. For example, in the Heetei caves (Trans-Baikal Territory), there is an ice formation, about four meters thick, as a result of surface wastewater entering the object during precipitation and melting of snow cover. When taking the ice core of this ice, the layered structure of this object is traced. The analysis of ice thickness samples showed a significant difference in the physical properties of ice thickness [15]. In addition to visual observation of the layering of the object and direct sampling of ice samples to identify the distinctive properties of the ice cover in height, there are contact devices for rapid analysis of the characteristics of the flowing ice, which are made, for example, in the form of a vaporizer [16]. On the surface of soils, as a rule, underground water ice is formed, and on the surface of ice sheets, as a result of layer-by-layer freezing of river waters, surface water ice is formed. On the territory of Russia, the volume of surface water ice is four times less than the volume of groundwater ice [17]. For this reason, most of this formation is located in riverbeds, for example, in places of freezing to the bottom of the ice sheet. One of the methods of remote detection of ice formations is space monitoring of the surface of the Earth's surface. For these purposes, a radiometric receiver is used that receives its own thermal radiation in the infrared (IR) range. The optimal time to detect ice is the period when there is no snow cover. During this period of time, the area of ice is close to the maximum [18, 19]. As a confirmation of this fact, Figure 1 shows an image taken from the Landsat-9 satellite in the visible range (a) and in the IR range (10.6...11.19 microns) (b). The satellite images show the area of Kadala village near Chita. The ice is fixed at a low temperature in the IR range, which is reflected in Fig. 1. 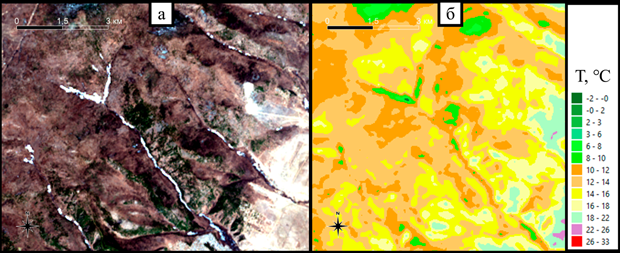
Figure 1 is a satellite image of a section of the Trans–Baikal Territory near Chita from the Landsat-9 satellite. a) in the visible range, b) in the IR (10.6 ... 11.19 microns). Date: May 03, 2023. As a result, using remote monitoring of the Earth from space in the infrared range, an Atlas of ice in the Northeastern part of Russia was created [20]. As a result of the data obtained, more than 10 thousand ice fields were identified in the North-East of Russia, with a total area of about 14 thousand km2, i.e. it is almost impossible to identify the physico-chemical features of ice formations using the IR range, only their area can be estimated.
The microwave range can come to the aid of identifying the features of ice remotely. The peculiarity of this range in the centimeter or decimeter wavelength range is its all-weather, as well as the fact that the thickness of the ice layer in which thermal radiation is formed ranges from several tens of centimeters to several meters for fresh ice, depending on the radiation length. Thus, when studying the fresh ice cover, the mineralization of the ice cover is determined by the power of radiothermal radiation, which is recorded by microwave radiometers, its physical properties and areas of introduction into the ice cover of various impurities in the ice captured in the ice cover during its formation (vegetation, gas bubbles, etc.) are revealed [21, 22]. For this reason, it is possible to remotely identify the structural features of ice formations by the power of their own radiothermal radiation of this medium. As mentioned above, the object under study, as a rule, is a plane-layered structure, sometimes with sharp transitional boundaries. For this reason, when calculating the radio brightness temperature (T i) of ice, it is possible to use a model in the form of a layered non-isothermal medium, the scheme of which is shown in Fig. 2. When calculating the T I, it is necessary to take into account the value of the relative complex permittivity of each layer ( ), temperature, viewing angle [23, 24]. ), temperature, viewing angle [23, 24]. 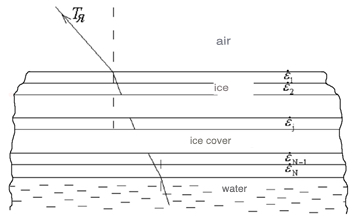
Figure 2 – A model of ice formation on the ice cover based on a layered non-isothermal medium. As a result of calculations based on this model, it is possible to determine the value of T I for various wavelengths and compare it with the obtained full-scale results of the thermal radiation power of ice, which are located both on soils and on ice sheets. When analyzing T I at different wavelengths and for two orthogonal polarizations (horizontal and vertical), it is possible to identify the features of the structure of the ice formation, for example, whether there is a liquid phase inside the object under study, etc. Experimental methodology To determine the radio brightness temperature of ice formations , radiometric receivers were used at a frequency of 13 GHz and 34 GHz with a sensitivity of 0.1 K and 0.2 K , respectively , at a time constant of 1 s. Calibration was carried out by the radiation reflected from the metal sheet of a cloudless atmosphere at low humidity and by its own thermal radiation of fresh water with a known temperature. The radiation of an undisturbed water surface was calculated using the model of a semi-infinite medium [25]. Two types of ice measurements were performed. The first experiment consisted in the study of artificial ice on the ground surface in winter. The soil was a sandy mixture with a humus content of about 20%. This object was carried out by daily additions of water from the initial mineralization of about 100 mg/l into a frame with linear dimensions of 140 ? 140 cm2. This was done to create a layered structure of ice, as it occurs in natural conditions. Thermistors recorded the temperature of the ice at different thicknesses. Meteorological parameters of the atmosphere were recorded. Radiometers were installed at an angle of 45 °. The output signal from the radiometers was recorded using the Agilent signal recording system. The measurements were carried out in February 2023 at ambient temperatures below -20 °C. A photo of the installation and its diagram are shown in Fig. 3 (a) and Fig. 3 (b). 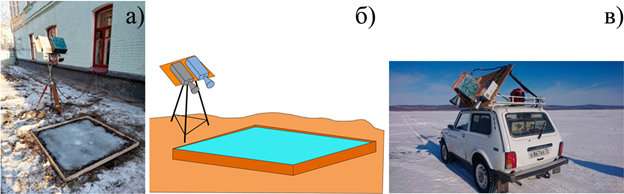
Figure 3 – Photos of the radiometric complex for the study of a – artificial ice on the ground, b – the scheme of the experiment for the study of ice, c – natural ice on the ice cover. The second experiment was to study the natural ice on the surface of the ice cover in winter. The measurements were carried out using a mobile radiometric complex located on the car at frequencies of 12 GHz and 34 GHz. The viewing angle was 45°. A photo of the installation is shown in Fig. 3 (b). The object of the study was an ice formation on the Ingoda River near the settlement of Atamanovka (Trans-Baikal Territory). The measurements were carried out in February 2023 . The mineralization of the ice cover was about 1 mg/kg. The thickness of the ice did not exceed 15 cm with an initial mineralization of 150 mg/kg. The thickness of the ice cover was 130 cm. The ice formed as a result of the onslaught on the river ice cover of groundwater squeezed out in the coastal zone of the Ingoda River due to the permafrost effect on the soil. For the analysis of natural glaciers located on the ground, we took an ice core from an ice formation located in the eastern part of the city of Chita. The maximum thickness of the ice formation is 2 meters, with an area of 80 m2. As a result, we discovered the layering of this object, which is shown in Fig. 4 (a). Moreover, it should be noted that variations in ice mineralization range from 40 to 100 mg/kg in the selected ice core. This fact suggests that the mineralization of the flowing water is different in different time periods. Layering manifests itself in the form of different concentrations of gas inclusions in the ice cover, as well as impurities in the ice of mineral particles washed by groundwater. When comparing artificial ice, layering is also observed, as shown in Fig. 4 (b). 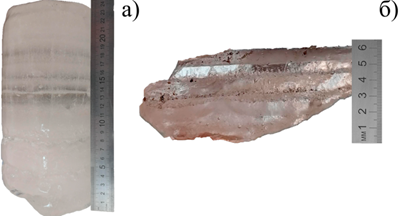
Figure 4 –Photos of a) an ice core removed from natural and b) a sample from artificial ice located on the ground. Thus, the created ice formation can be approximated as a model of natural ice located on the ground. The results obtained and their justification According to the data of experiments and calculations of radio brightness temperatures of ice, the following results were obtained. In the study of artificial ice on the ground, it was found that when water flows, the radio brightness temperature of the medium under study decreases, both on vertical and horizontal polarizations. This is due to the fact that thermal radiation is formed in a relatively small surface layer and the radiation of the Fresnel coefficient for water is greater than that of the soil. For this reason, when the water masses reach the earth's surface by the radiometric method in the microwave range, this process can be observed. So, there is a problem of detecting the outlet of water under the snow cover, since this process is not visually determined, then this issue can be resolved using the radiometric method of observing the object. This is possible due to the fact that the snow cover is almost transparent in the centimeter and decimeter ranges. When water crystallizes in the upper layer of ice, variations in radio brightness temperature occur, which is associated with the growth of the upper layer of growing ice on the water surface. Since the water layer during the experiment did not exceed 1 cm, then at a frequency of 34 GHz these variations of T I go through one cycle, and at a frequency of 12 GHz a quarter of a cycle. If the layer of newly formed ice is larger, i.e. the layer of water that comes out on the ice will be several centimeters, then the variations in radio brightness temperature will take much longer. Variations of T I during the growth of the ice cover are considered in [26]. As can be seen from [26], these variations depend on the mineralization of the ice, the angle of observation and the type of polarization. In addition, the temperature of the fresh layer of ice at the initial time is about 0 ° C, then as it cools, the temperature will decrease. The results of an experimental study of the power of radiothermal radiation of ice on the ground are shown in Fig. 5. 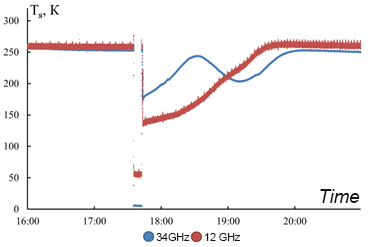 Figure 5 – Radio brightness temperature of artificial ice on the ground at frequencies of 34 GHz and 12 GHz. Date: February 22, 2023 Vertical polarization. The calculated values for a layered non-isothermal model with flat ice boundaries showed good agreement with the experimental data obtained. During radiometric measurement of natural ice located on the surface of the ice sheet at frequencies of 12 GHz and 34 GHz, it was found that it leads to an increase in T I (Fig. 6). This fact is due to the fact that on the surface of the ice sheet, which is close to distilled water in mineralization, there is a layer of ice with increased mineralization. As it was shown in [21], an increase in mineralization in the ice cover leads to an increase in the radio brightness temperature of the object under study. 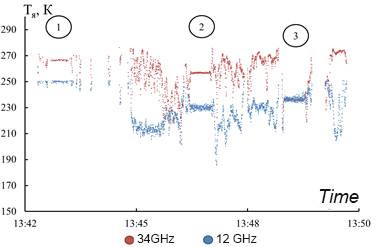
Figure 6 – Radio brightness temperature of ice on the Ingoda River ice cover at frequencies of 34 GHz and 12 GHz. Date: February 01, 2023 Vertical polarization. 1 – river; 2 – ice; 3 – river Earlier in [27], an increase in the value of T I in the centimeter range of fresh ice cover was also shown due to the influence of ice on it. A photograph of the ice under study at that moment is shown in Fig. 7 (a) and a trace record of the value of the T I at a wavelength of 2.3 cm on vertical polarization is shown in Fig. 7 (b). 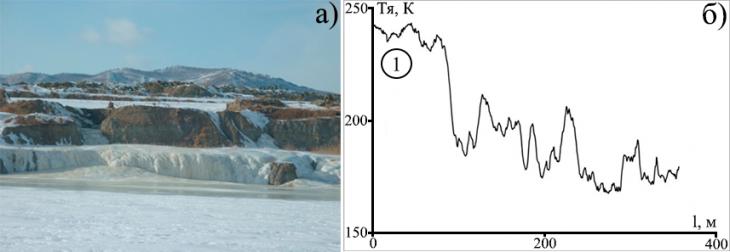
Figure 7 – a) Photo of ice on a man-made reservoir in Baley, b) Track record of the ice cover. The number 1 indicates a section of ice cover with ice 10 cm thick. March 2014. When calculating for a layered non-isothermal medium, the following results were obtained, presented in Table 1. Table 1 – Calculations of radio brightness temperature values (in Kelvins) depending on the structure layer on horizontal (GP) and vertical (VP) polarizations | Structure |
2 cm | 5 cm | 10 cm | 20 cm | | GP | VP | GP | VP | GP | VP | GP | VP | | Air/ground (1 m) | 197,9 | 249,9 | 187,7 | 244,2 | 184,1 |
242 | 183 | 241,3 | | Air / ice (5 cm) / ground (1 m) | 221,7 | 258,5 | 228,5 | 260,2 | 236,2 | 261,3 | 199 | 247,9 | | Air / ice (10 cm) / ground (1 m) | 222,6 | 258,3 | 235,4 | 261,5 | 223,2 | 257,8 |
238,7 | 262 | | Air / ice (50 cm) / ground (1 m) | 221,9 | 256,9 | 221,7 | 257,5 | 220,2 | 256,4 | 211,3 | 253,1 | | Air / ice (100 cm) / water (10 cm) | 162,8 | 193,2 | 136,7 | 164 | 130,7 | 157,5 | 128,5
| 155 | | Air / ice (5 cm) / ice (100 cm) / water (10 cm) | 189 | 220,9 | 147,2 | 175,1 | 136,4 | 163,2 | 130,8 | 157,5 | | Air / ice (10 cm) / ice (100 cm) / water (10 cm) | 203,5 | 236,6 | 156,7 | 185 | 141,5 | 168,6 | 133,6 |
160,2 | | Air / ice (50 cm) / ice (100 cm) / water (10 cm) | 221,7 | 256,7 | 199,1 | 231,3 | 173,4 | 202,5 | 151,3 | 178,5 | As a rule, the formation of ice occurs at fairly low temperatures of the lower layer of the atmosphere. In this connection, the water surface can be quite strongly supercooled. During the phase transformation of supercooled water into ice at a water temperature of -23 ° C, ice Ih, not widespread in terrestrial conditions, can form, but ice 0, which was previously discovered by computer modeling [28] and experimentally found by microwave measurements [29]. This modification of ice is a ferroelectric, therefore, ice 0 has special physico-chemical properties distinctive from ice Ih. Thus, a thin layer of ferroelectric ice on a dielectric, which is ice Ih, will lead to the formation of a medium with conductive properties similar to a metal surface [30]. For this reason, when remotely examining the newly formed top layer of ice at sufficiently low temperatures, one should take into account the fact that a ferroelectric phase of ice can also form in this medium. The internal structure of the ice should also be taken into account. As shown in [31], in the millimeter range, thermal radiation is affected by scattering on internal inhomogeneities of the medium, which, according to the authors [31], occurs on salt crystallohydrates and can be caused by increased electrical conductivity of thin films of water on the surfaces of these crystals. Conclusions Thus, experimental and theoretical studies of thermal radiation of ice, both on soils and on the ice cover allow us to draw the following conclusions. 1. As a result of field, laboratory and theoretical investigations, the possibility of registering ice formations by radiothermal radiation of these objects in the microwave range has been shown, which can be used for their registration using low-flying aircraft with microwave radiometric equipment installed on them. 2. In the case of the existence of a layer of water on ice, the radio brightness temperature, which characterizes the power of the environment's own radiothermal radiation, will be significantly lower than an object on the surface of which there is no water mass. It should be noted that the snow cover over the object under study does not significantly contribute to the value of the radio brightness temperature in the centimeter and decimeter ranges.
3. By the value of the radio brightness temperature in the microwave range for several ranges, it is possible to indirectly judge the power of ice formation, i.e. to estimate the thickness of the ice. At the same time, it is necessary to take into account variations in the radiofrequency temperature of the medium depending on its thickness due to interference of radiothermal radiation of a plane-layered medium. 4. It is necessary to take into account the external temperature at which the formation of ice occurs. At temperatures below -23 °C, ferroelectric ice 0 can form from supercooled water, a new modification of crystalline ice that differs from widespread ice Ih. 5. The integrated use of remote sensing methods of ice formations in a wide range of frequencies, which include the visible, infrared and microwave ranges, expand the possibility of monitoring such environments.
References
1. Serykh, I.V., & Tolstikov, A.V. (2022). Climate change in the western part of the Russian Arctic in 1980-2021 Part 1. Air temperature, precipitation, wind. Problems of the Arctic and Antarctic, 68(3), 258–277. doi:10.30758/0555-2648-2022-68-3-258-277
2. Serykh, I.V., & Tolstikov, A.V. (2022). Climate change in the western part of the Russian Arctic in 1980-2021 Part 2. Soil temperature, snow, humidity. Problems of the Arctic and Antarctic, 68(4), 352-369. doi:10.30758/0555-2648-2022-68-4-352-369
3. Sherstyukov, A.B. (2007). Permafrost of Russia in the context of global warming. Evolution and dynamics of ecosystems, 4, 8–11.
4. Konishchev, V.N. (2011). Response of permafrost to climate warming. Cryosphere of the Earth, 15(4), 15–18.
5. Solomon, S., Qin, D., Manning, M., Chen, Z., Marquis, M., Averyt, K.B., Tignor, M. & Miller H.L. (Eds.), Lemke, P., Ren, J., Alley, R.B., Allison, I., Carrasco, J., Flato, G., Fujii, Y., Kaser, G., Mote, P., Thomas, R.H., & Zhang, T. (2007). Observations: Changes in Snow, Ice and Frozen Ground. Chapter 4. Climate Change: The Physical Science Basis. Contribution of Working Group I to the Fourth Assessment Report of the Intergovernmental Panel on Climate Change. P. 337–383. Cambridge, United Kingdom and New York, NY, USA: Cambridge University Press.
6. Porfiriev, B.N., Eliseev, D.O., & Streletsky, D.A. (2019). Economic assessment of the consequences of permafrost degradation under the influence of climate change for the sustainability of road infrastructure in the Russian Arctic. Bulletin of the Russian Academy of Sciences, 89(12), 1228–1239.
7. Noskova E.V., Vakhnina I.L. (2023). Analysis of modern spatio-temporal changes in air temperature in the Trans-Baikal Territory. Geographic Bulletin, 1(64), 116–126. doi:10.17072/2079-7877-2023-1-116-126
8. Balybina, A.S., & Trofimova, I.E. (2019). Dynamics of soil temperature in the territory of Transbaikalia under conditions of climate change. Meteorology and Hydrology, 10, 109–116.
9. Smakhtin, V.K. (2021). Evaluation of changes in air temperature and precipitation in the territory of Transbaikalia. Hydrometeorological research and forecasts, 2(380), 138-146. doi:10.37162/2618-9631-2021-2-138-146.
10. Zvyagintseva, V.V., & Zvyagintsev, O.Yu. (2022). Dynamics of ice formation in the conditions of eastern Transbaikalia: a study using Earth remote sensing data. Bulletin of the Transbaikal State University, 28(7), 17-25. doi:10.21209/2227924520222871725
11. Ivanova, M.A., & Zvyagintsev, V.V. (2019). Ice phenomena in the Trans-Baikal Territory (current state, forecast). Technospheric safety of the Baikal region: coll. scientific Art. according to the materials of the International scientific-practical. conf. P. 159–166. Chita: ZabGU Press.
12. Shesternev, D. M., & Verkhoturov, A. G. (2016). Impact of icing on engineering structures. Bulletin of the Transbaikal State University, 22(10), 30–40. doi:10.21209/2227-9245-2016-22-10-30-40
13. Alekseev, V.R. (2005). Landscape indication of icing phenomena. Novosibirsk: Nauka.
14. Voitkovsky, K.F. (1999). Fundamentals of glaciology. Moscow: Nauka.
15. Zheleznyak, I.I., Tsyrenzhapov, S.V., & Gurulev, A.A. (2020). Study of massive ice, mineral formations and air of the permafrost karst cave Heetei in Transbaikalia. Bulletin of the Transbaikal State University, 26(7), 33-43. doi: 0.21209/2227-9245-2020-26-7-33-43
16. Lukyanov, P.Yu., Zheleznyak, I.I., & Gurulev, A.A. (2017). Device for layer-by-layer measurement of the physical properties of an ice massif in its natural occurrence. Instruments and Experimental Technique, 6, 90-93. doi:10.7868/S0032816217060076
17. Alekseev, V.R. (1987). Ice. Novosibirsk: Nauka.
18. Chernykh, V.N., Ayurzhanaev, A.A., Zharnikova, M.A., Sodnomov, B.V., Shikhov, A.N., Tsydypov, B.Z., Garmaev, E.Zh., & Pyankov, S.V. (2022). Mapping of icings in the transboundary basin of the river Chikoy. Geographic Bulletin, 3(62), 169-179. doi:10.17072/2079-7877-2022-3-169-179
19. Hall, D.K., Riggs, G.A., & Salomonson, V.V. (1995). Development of methods for mapping global snow cover using Moderate Resolution Imaging Spectroradiometer (MODIS) data. Remote Sens. Environ, 54, 127–140. doi:10.1016/0034-4257(95)00137-P
20. Alekseev, V.R., Makarieva, O.M., Shikhov, A.N., Nesterova, N.V., Ostashov, A.A., & Semakina, A.V. (2020). Catalog and atlas of giant ice-taryns of the north-east of Russia. In the collection: Fourth Vinogradov Readings. hydrology from knowledge to worldview. Collection of reports of the international scientific conference in memory of the outstanding Russian scientist Yuri Borisovich Vinogradov. P. 1037-1042. Saint Petersburg: Saint Petersburg State University Press.
21. Bordonsky, G.S., & Gurulev, A.A. (2008). Peculiarities of radiothermal radiation of ice covers of water bodies with different degree of mineralization. Water resources, 35(2), 210-215.
22. Gurulev, A.A., & Krylov, S.D. (2004). The use of radiothermal radiation to control pollution of the delta of the Selenga River. Geography and Natural Resources, 1, 72-75.
23. Klepikov, I.N., & Sharkov, E.A. (1992). Theoretical studies of self-radiation of sharply inhomogeneous non-isothermal media. Earth exploration from space, 6, 3-15.
24. Tikhonov, V.V., Khvostov, I.V., Romanov, A.N., Sharkov, E.A., Boyarsky, D.A., Komarova, N.Yu., & Sinitsky, A.I. (2020). Peculiarities of own radiation of the Gulf of Ob in the L-band during the freeze-up period. Earth exploration from space, 3, 59-76. doi:10.31857/S0205961420030070
25. Nikitin, O.R., Sadovsky, I.N., & Kovalev, M.V. (2008). Microwave radiometry of the water surface. Methods and devices for transmitting and processing information, 10, 106-112.
26. Gurulev, A.A., Orlov, A.O., & Tsyrenzhapov, S.V. (2011). Thermal radiation of a three-layer medium with a thin intermediate layer. Earth exploration from space, 4, 5-11.
27. Gurulev, A.A., Orlov, A.O., & Tsyrenzhapov, S.V. (2018). Influence of aufeis on the radiothermal radiation of fresh ice covers. Natural and technical sciences, 8(122), 109-111.
28. Quigley, D., Alfè, D., & Slater, B. (2014). On the stability of ice 0, ice I, and Ih. Journ. of Chemical Physics, 141, 161102.
29. Bordonsky, G.S., & Orlov, A.O. (2017). Signs of the appearance of ice "0" in moistened nanoporous media during electromagnetic measurements. Letters to the Journal of Experimental and Theoretical Physics, 105(8), 483-488.
30. Korobeynikov, S.M., Royak, M.E., Melekhov, A.V., Agoris, D.P., Pyrgioti, E., Soloveitchik, & Yu.G. (2005). Surface conductivity at the interface between ceramics and transformer oil. Journal of Physics D: Applied Physics, 38(6), 915-921. doi:10.1088/0022-3727/38/6/021
31. Bordonskiy, G.S., Gurulev, A.A., Orlov, A.O., & Tsyrenzhapov, S.V. (2022). Study of the ice loss factor from fresh water in the millimeter range. Siberian Aerospace Journal, 23(3), 532-541. doi:10.31772/2712-8970-2022-23-3-532-541
Peer Review
Peer reviewers' evaluations remain confidential and are not disclosed to the public. Only external reviews, authorized for publication by the article's author(s), are made public. Typically, these final reviews are conducted after the manuscript's revision. Adhering to our double-blind review policy, the reviewer's identity is kept confidential.
The list of publisher reviewers can be found here.
The subject of the study, according to the author, is the peculiarities of radiothermal study of ice formations on soils and on ice sheets of rivers and lakes in the microwave range. Research methodology based on the analysis of the article, it can be concluded that the methods of remote detection of ice formations are used for space monitoring of the Earth's surface. For these purposes, a radiometric receiver is used, which receives its own thermal radiation in the infrared (IR) range, as well as the analysis of literary data. To determine the radio brightness temperature of ice formations, radiometric receivers at a frequency of 13 GHz and 34 GHz with a sensitivity of 0.1 K and 0.2 K, respectively, at a time constant of 1 s. The author undertook expeditionary field research methods, taking an ice core from an ice formation, experiments in the study of natural ice on the surface of the ice cover in winter with subsequent in-house processing. The relevance of the topic of monitoring is unconditional and consists in obtaining information about ice phenomena in the Subarctic and Arctic regions with an annual increase in precipitation is an urgent task and is of great practical importance. The calculated values for a layered non-isothermal model with flat ice boundaries showed good agreement with the experimental data obtained. The author's research helps to understand the mechanism of reaction to changes in weather and climatic conditions for the theory of cryolithogenesis. The scientific novelty lies in the attempt of the author of the article, based on the conducted research, to conclude about the results of field, laboratory and theoretical investigations of the possibility of registering ice formations by radiothermal radiation of these objects in the microwave range, which can be used for their registration using low-flying aircraft with microwave radiometric equipment installed on them. This is an important addition in the development of geocryology. Style, structure, content the style of presentation of the results is quite scientific. The article is provided with rich illustrative material reflecting the process of ice formation in the soil. The integrated use of remote sensing methods for ice formations in a wide range of frequencies, which include the visible, infrared and microwave ranges, expand the possibility of monitoring such environments. The study processes are considered in laboratory conditions, which makes the results presented by the author of the article very interesting. However, there are a number of questions, in particular: The author of the article should provide data on temperature growth over the past 10 years during the year, as well as in winter and summer, it would be desirable to provide information on the statistical analysis of deviations from the average, the error value, the correlation value. The bibliography is very comprehensive for the formulation of the issue under consideration, but does not contain references to normative legal acts. The appeal to the opponents is presented in identifying the problem at the level of available information obtained by the author as a result of the analysis. Conclusions, the interest of the readership in the conclusions there are generalizations that made it possible to apply the results obtained. The target group of information consumers is not specified in the article.
Link to this article
You can simply select and copy link from below text field.
|
|