|
MAIN PAGE
> Back to contents
Arctic and Antarctica
Reference:
Zemlianskova A.A., Makarieva O.M.
Modeling of runoff formation processes with aufeis feed in mountain cryosphere of the north-east of Russia
// Arctic and Antarctica.
2024. № 2.
P. 1-20.
DOI: 10.7256/2453-8922.2024.2.69780 EDN: EAMLTK URL: https://en.nbpublish.com/library_read_article.php?id=69780
Modeling of runoff formation processes with aufeis feed in mountain cryosphere of the north-east of Russia
Zemlianskova Anastasiia Aleksandrovna
ORCID: 0000-0002-2249-5708
Laboratory assistant, Laboratory of Monitoring and Forecasting Climate Change and the Environment, North-Eastern State University, Magadan, Russia;
Junior Researcher and Postgraduate Student of the Institute of Earth Sciences, St. Petersburg University
685017, Russia, Magadan region, Magadan, Portovaya str., 13

|
anastasiazemlanskova@gmail.com
|
|
 |
Other publications by this author
|
|
|
Makarieva Ol'ga Mikhailovna
ORCID: 0000-0002-2532-4306
PhD in Technical Science
Head of Laboratory of Monitoring and Forecasting Climate Change and the Environment, North-Eastern State University, Magadan, Russia;
Leading Researcher of Earth Sciences, St. Petersburg University
685000, Russia, Magadan region, Magadan, Portovaya str., 13
|
|
omakarieva@yandex.ru
|
|
 |
Other publications by this author
|
|
|
DOI: 10.7256/2453-8922.2024.2.69780
EDN: EAMLTK
Received:
07-02-2024
Published:
15-02-2024
Abstract:
Aufeis are a key element in the chain of water exchange processes in the permafrost zone. The hydrological role of aufeis in the formation of river flow can be comparable to that of glaciers. Observations of aufeis during the construction of the Baikal-Amur Mainline showed that the share of aufeis runoff in the annual river flow can reach 35% for watersheds with an area of up to 500 km2. Despite the long history of studying aufeis and the results achieved, there are no methods for predicting the development of aufeis processes, as well as hydrological models that take into account the share of aufeis feeding in river runoff. This is due to the lack of observational data on the dynamics and development factors of aufeis. In the last century, long-term studies were carried out on some aufeis in Siberia and the Far East. One of these unique objects is the giant Anmangynda aufeis, which forms in the upper reaches of the Kolyma River basin. The aim of the research is to study the hydrological regime of the Anmangynda river basin and develop a method for accounting of aufeis runoff (module «Aufeis») in the distributed hydrological model «Hydrograph». The module “Aufeis” takes into account two factors of aufeis destruction – under the influence of solar radiation and thermal erosion destruction. The input data is the area of aufeis at the beginning of the warm season and daily meteorological data. The calculation parameters are the coefficients of ice melting and evaporation from ice, as well as the coefficient of the relative area of aufeis depending on the period of destruction, calculated for the modern climatic period. The result of the calculation is the aufeis runoff and the characteristics of aufeis for a given interval. Based on historical data and materials obtained during own field research, the module «Aufeis» was tested. The deviation of the calculated and observed values was 2—10% and 1—9% for the maximum values of the area and volume of the Anmangynda aufeis, respectively. Results of numerical calculations for the period 1967–2022 revealed the dynamics of the contribution of the Anmangynda aufeis to the river flow in different seasons. The expanded functionality of the Hydrograph model has improved the quality of modeling for rivers where aufeis form. For the river basin Anmangynda average Nash-Sutcliffe coefficient and annual runoff error were 0,57 and 13,0% compared to 0,41 and 18,0% when the module «Aufeis» was not used.
Keywords:
aufeis, aufeis resources, aufeis regulation, Hydrograph model, mathematical modeling, permafrost, Anmangynda river, remote sensing, water balance, cryosphere
This article is automatically translated.
You can find original text of the article here.
Introduction Ice is a specific form of seasonal glaciation characteristic of the mountainous conditions of permafrost [1-3]. The area of one object can be measured in tens of km2, and the ice thickness can reach 10-12 m [4]. Under conditions of global climate warming, there is a reduction in the size of glaciers [5, 6] and their migration, which affects the hydrological regime of rivers in the cryolithozone and geocryological conditions [3, 7]. The large size of the glaciers provides high identifiability of these objects in satellite images, which allows them to be used as qualitative indicators of water exchange transformation in vast, inaccessible and insufficiently studied territories of the North-East of Russia, where, according to recent estimates, there are at least 6,683 glaciers with a total area of about 4,500 km2 [8]. Ice is a key element in the chain of water exchange processes in the permafrost zone. According to B. L. Sokolov's observations, in May-June up to 50-90% of the ice runoff falls into the river runoff, in July this share decreases to 30%, and in August — to 7%. The hydrological role of glaciers in the formation of river runoff can be comparable to such snow-ice phenomena as glaciers, which is confirmed by the results of many studies [6, 9, 10]. Observations of ice during the construction of the Baikal-Amur mainline have shown that the share of ice runoff in the annual river flow can reach 35% for catchments up to 500 km2. During the spring flood, this proportion ranges from 5 to 40%, and in the summer runoff does not exceed 10% [11]. Glaciers can play an important role in the water supply of arid regions [2, 12]. Despite the history of studying this natural phenomenon (more than 100 years) and the results achieved, there are no methods for predicting the development of ice processes, as well as hydrological models that take into account the share of ice nutrition in river runoff. At the moment, research is underway to create conceptual models of ice formation [13, 14], which will allow for a better understanding of their nature. In well-known hydrological models, such as the HBV-Light model [15, 16]; PREVAH [17], etc. With the help of a system of equations, glacier destruction and glacial runoff are satisfactorily described, they can also be used in relation to ice by regulating the snow index, but this loses all physical meaning [18]. The problem of developing a mathematical apparatus that allows predicting the size and nature of ice processes, as well as taking into account their impact on river flow and other components of the natural environment lies in the fact that there is no state program for studying ice. Ground-based observations in Russia are carried out thanks to grant support [19-21 et al.] by separate scientific groups, the results of which are often not comparable with each other. A comprehensive program for studying ice at key sites in different regions is needed, which will take into account the peculiarities of climate, geological structure, relief, geocryological characteristics, and landscapes for the formation of ice. Satellite monitoring data will allow for a retrospective assessment of changes in their sizes [5, 22]. In the last century, on the icy areas of Samokit, Verina, Anmangynda, etc. Comprehensive observations of their water regime and the role of ice in the formation of river runoff were carried out. Therefore, it is these objects that are proposed to be considered primarily as key objects of the network of ice telemetry points. In the basin of the Anmangynda River (Kolyma River basin), a long series of data was obtained (1962-1991) on the area, volume, thickness of giant ice in different seasons, as well as the hydrological regime of the river in the alignment below the ice (1962-1987) and on a large tributary stream. Olchan (1962-1978). Based on these materials, integral curves for reducing the morphometric characteristics of ice were obtained, which were used in calculations on other objects [10, 23, 24]. In this paper, using the example of the Anmangynda River basin, it is proposed to study the hydrological regime, and also, using a long series of data using mathematical modeling methods, to develop a method for accounting for ice nutrition. The object of the study The catchment area of the Anmangynda River (flows into the Detrin River, a tributary of the Kolyma River), for which the calculation is carried out, is 376 km2. The study area belongs to the zone of continuous permafrost distribution, its thickness reaches 300 m, decreases to 80-100 m in river valleys and is interrupted in talik zones [25]. The geological structure is represented by sedimentary rocks of the Upper Triassic, Jurassic and Cretaceous. According to [26], the depth of zero heat turns is 11.5 and 13.5 m at an altitude of 712 and 1027 m, respectively. The height of the catchment area of the Anmangynda river ranges from 700 to 1850 m. The river valley at the ice formation site (Fig. 1) has a trapezoidal shape with gentle slopes. The length of the ice glade is about 6-7 km, with an absolute height of 700-770 m. The slopes are covered with larch forest on a moss-lichen litter, in places cedar elfin and patches of open tundra. The soils are mountainous, podzolic, tundra and mountain tundra. 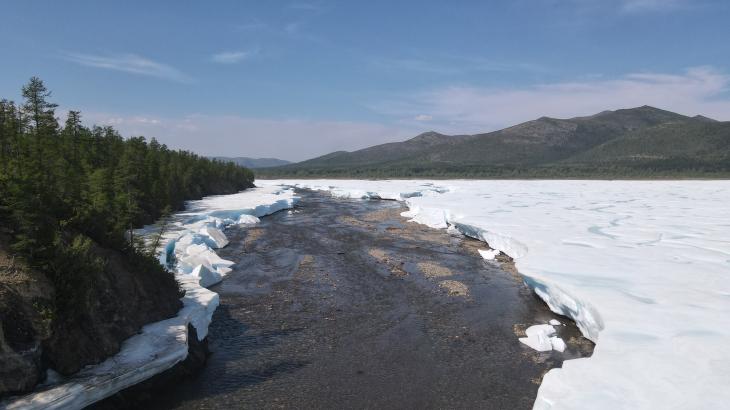
Fig. 1. The Anmangynda ice. The valley floor is composed of alluvium, in the upper part it is poorly covered with shrubs and moss cover. In areas where the ice has been lying for a long time, a hummock is formed, as well as dense willow. Ice is formed annually, in the modern period its area can reach 5.4 km2 (2000), and the historical maximum was 6.8 km2 (1978). The average volume of ice for the period 1963-1991 was 8.5 million m3, which is 22.6 mm of annual runoff layer. Modern estimates show a significant decrease in the total size of the Anmangynda ice [27], so in 2000-2022 the maximum volume according to estimated estimates did not exceed 8.2 million m3, and on average is 7 million m3.
The water regime of the Anmangynda River is characterized by data from a hydrological post located below the ice. Year-round runoff is observed in the area of the polynya above the ice and in the middle part of the ice glade. The climate of the studied area is sharply continental, the average annual temperature at the Ust-Omchug station (576 m above sea level) for the period 1967-2022 was -9.8 °C (in July +14.5 ° C, in January -33.4 °C). In the coldest months (December-January), the temperature drops to -57?, and in the warmest months it rises to +33.6? (July). The average annual precipitation is 341.2 mm (m/s Ust-Omchug). Snow cover in the mountains is established at the end of September, and throughout the basin in mid-October. According to field research data from 2021-2023, the snow height in different parts of the catchment at the end of March ranges from 48 to 84 cm, whereas at the Ust-Omchug m/s it is 25 cm. Materials and methods of research Historical data The materials of the Kolyma Department of the Hydrometeorological Service were collected, digitized and analyzed for the period 1962-1991. They included information about the dynamics of the area, volume, and thickness of ice in different seasons of the year. The analysis and results are described in detail in [27, 28]. It is noted that over the past 60 years, the maximum ice sizes have decreased by 15 and 17% for the area and volume, respectively (on average from 5.5 to 4.7 km2, from 8.5 to 7.0 million m3). Information on the hydrological regime was obtained for the lower reaches of the Anmangynda River (1962-1987) [29]. A modern series of observations The assessment of the current ice area was carried out based on the analysis of satellite images of Landsat (TM, ETM+ and OLI sensors) and Sentinel-2 (MSI sensor) satellites for the period 1999-2022 and 2016-2022, respectively. The accuracy of determining the area of ice from the images depends on its resolution, the deviation from the actual size of the ice can be up to 15%. Satellite image data does not allow us to estimate the volume of ice, so the calculation formula (1) is used: W=0,364*S1,167, (1) where W is the volume of ice (thousand m3), S is the area of ice, thousand m2, the coefficients a and n were proposed in [27]. For the historical period (1963-1990), the formula showed satisfactory results. The deviation of the calculated values from the observed values was 0.01—2.09 million m3 or 0-5 mm of runoff. With the help of an unmanned aerial vehicle, an ice clearing was photographed in 2021 and 2022. Based on the results of the work, orthophotoplanes were built, the area and volume of ice was determined [30], as well as the change in ice thickness. The accuracy of volume determination depends on many factors — camera stabilization, number of control points, lighting, etc. A comparison of ground-based observations with UAV data showed that the ice thickness error in the warm season ranged from 0.04 to 1.70 m. In case of gross errors, the materials were not used in the analysis. Thus, the accuracy of determining the volume varied from 0.02 to 0.46 million m3 (5-13%), which is from 0 to 1.5 mm of runoff for the Anmangynda River basin. The Hydrograph model The mathematical model "Hydrograph" with distributed parameters combines both physically sound and conceptual methods, which allows achieving a balance between the complexity of calculations and the availability of parameterization of the model [31]. It was used to calculate the flow of rivers in the Kolyma River basin, where permafrost rocks are common [32, 33], and the results were accepted as satisfactory. The calculations did not assess the contribution of ice nutrition to river runoff, although in the North-East of the country it may amount to 0.2-11.0% during the spring flood (May-June, the Kolyma River basin) [8]. In the previously developed version of the Hydrograph model, when calculating the processes of runoff formation in the permafrost zone, the share of the contribution of ice nutrition to river runoff was not taken into account. The authors of the work proposed the calculation block "Ice", describing the processes of destruction of ice and accounting for ice nutrition in the formation of river runoff. As part of the adaptation of the algorithm and the program of the model, both the calculation schemes and the interface were modified. To use the Hydrograph model, the schematization of the river basin is carried out. Two systems are used — 1) a set of representative (calculated) points (RT) representing the centers of the cells of the hexagonal grid, and 2) a system of flow-forming complexes (SFCs) determined by the type of landscape, soil, vegetation, altitude zone. The block "Ice" is a calculation algorithm for an array of ice, timed to a specific RT. For each ice within the RT area, information about its characteristics and location is set - geographical coordinates (latitude, longitude, altitude), maximum area (S max) and the volume (W max) of ice (determined according to field research data or using calculation formulas), the average thickness of ice (D max), as a quotient of the volume and area of ice. Input meteorological data, namely effective temperature (Temp ef) and the humidity deficit (Def ef) of the air are calculated taking into account the absolute height of the ice.
The "Ice" block was based on the method of B. L. Sokolov, which is based on the dynamics of reducing the area of ice during the warm period, the beginning of which is associated with the date of transition of the average daily air temperature through zero towards positive values [10]. The volume of ice varies depending on the melting coefficient. When developing the method, B. L. Sokolov used a number of data on the dynamics of ice phenomena in the Anmangynda ice, which currently do not meet modern climatic conditions. Therefore, according to satellite monitoring data for the period (2000-2022), the regional curve of destruction of the relative area of the Anmangynda ice was clarified. To calculate the ice runoff, two factors affecting the destruction of ice are taken into account – the effect of solar radiation (Abl i) and thermal erosion processes, when, under the influence of river and groundwater runoff, ice blocks break off from the main body of ice and quickly (in the proposed algorithm – instantly) collapse in the water flow. This was proposed for the first time, previously block destruction was either not taken into account, or a solution of several equations was proposed [10]. The melting coefficient (k t) was calculated according to field research data from 2020-2023 on the Anmangynda ice, it was found that for this object it averages 1 mm/?·day and varies from 0.1 to 4.2 mm/?·day depending on the month. In the model, it is set to be the same for the entire calculated time interval. The coefficient of evaporation from ice (m/mbar·s) is also introduced. The minimum size of the ice for which the calculation is carried out is 0.6 km 2. The estimated time interval (RIV) in the Hydrograph model can be any (but not more than a day), depending on the availability of data. In this work, an interval of a day is proposed, so for each day it is determined how the area and volume of ice have changed as a result of the action of solar radiation and thermal erosion destruction, taking into account evaporation from the ice surface. The thickness of the ice decreases evenly over the entire area of the ice, depending on the effective air temperature and the melting coefficient of the ice (solar radiation block). The volume of broken ice is calculated as the change in area multiplied by the average thickness of the ice (block thermomechanical destruction of ice). The total loss of ice volume on the RIVE is recalculated into a layer and a hydrograph of the ice runoff. Also, for each REEVE, the area, volume and average thickness of the ice are determined, as well as the layer, volume and flow rate of the ice runoff, the evaporation layer from the ice, which are used for further calculation. Below are the formulas used in the "Ice" block (Fig. 2). 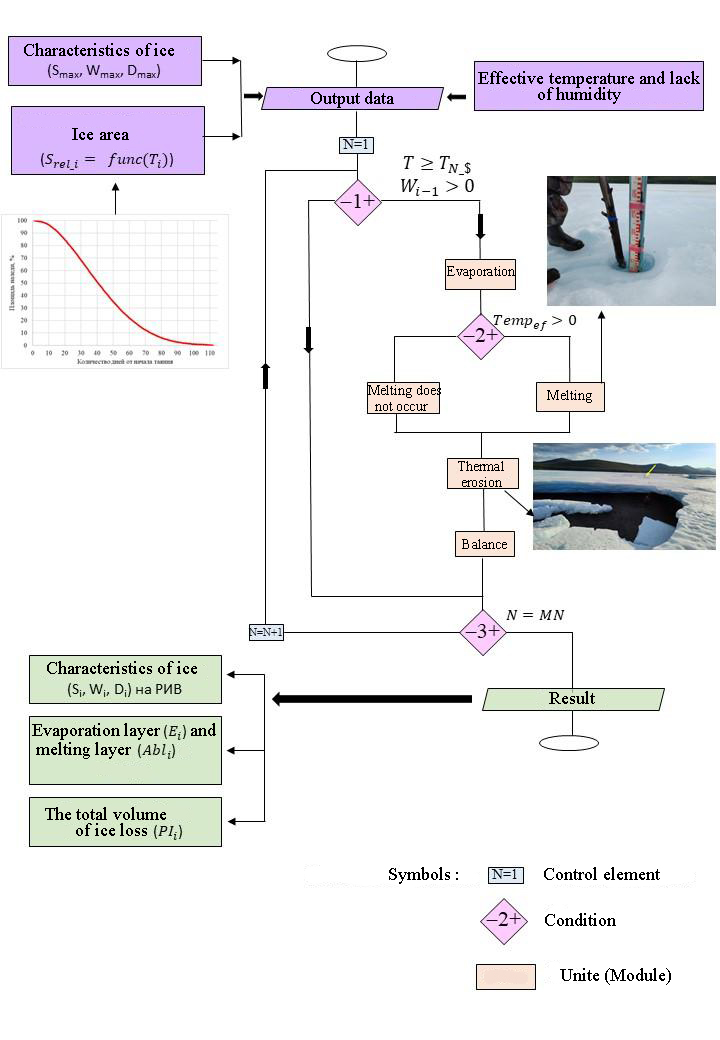
Fig. 2. Block diagram "Ice". 1) Solar radiation — the change in the average thickness of ice per RIVE is calculated as a result of the arrival of solar energy. 
If   (if the melting layer under the influence of solar radiation exceeds the thickness of the ice). (if the melting layer under the influence of solar radiation exceeds the thickness of the ice). 

2) Thermomechanical destruction of ice — the change in the area and volume of ice due to block destruction is calculated. 


3) Balance — the total volume of ice loss in the I-th RIVE is calculated due to evaporation, block destruction and melting under the influence of solar radiation. 
The approbation of the method for calculating the area and volume of ice for each REEVE (Fig. 3) showed that the deviation of the obtained values on average does not exceed 10% of the maximum characteristics of the ice, and the largest deviation for a particular day was 24% (Table. 1), which is considered satisfactory. The maximum calculation error is observed in the period July—August, when the size of the ice is on average less than 10% of the area and volume values before melting. 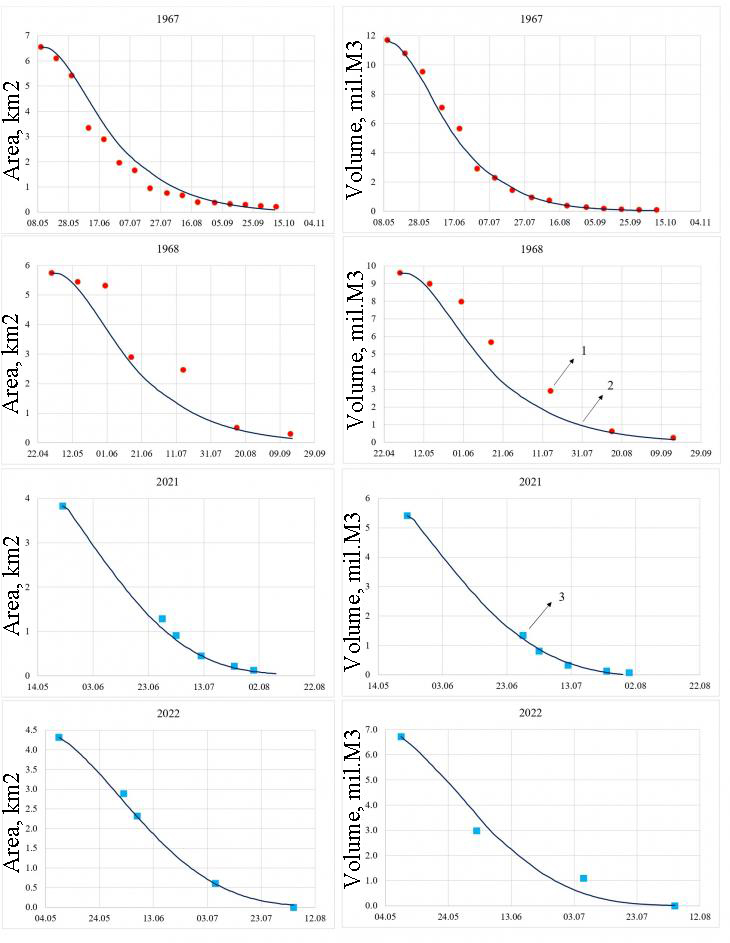
Fig. 3. Approbation of the method for calculating the area and volume of ice based on ground—based observations (1) and materials from an unmanned aerial vehicle (3). Curve (2) is the result of using the "Ice" block. Table 1. Deviation of calculated values of ice characteristics from those observed for each year.
| | R area, % | R volume, % | | Year | Average | MIN | MAX | Average | MIN | MAX | | 1967 | 5 | 0,4 | 17,0 | 2 | 0,04 | 8,3 | | 1968 | 10 | 0,9 |
24,5 | 9 | 0,9 | 18,6 | | 1970 | 2 | 0,2 | 5,2 | 9 | 0,9 | 16,9 | | 2021 | 2 | 0,3 | 5,7 | 1 | 0,9 | 2,0 | | 2022 | 2 | 0,4 |
4,7 | 9 | 8,9 | 9,5 | R is the deviation from the maximum value (%). Parameterization of the Hydrograph model and the data used In order to parameterize the model, a map of permafrost landscapes of the Anmangynda river basin (Fig. 4), compiled in 2022, was used to isolate runoff-forming complexes (SFCs) [34]. Previously developed schematizations of soil and vegetation cover and model parameters published in [32, 33, 35] were used for each SFK. Data from the Ust-Omchug meteorological station (1967-2022, Table 2) were used as input information. When interpolating meteorological elements, own field materials (2020-2023) were taken into account, including series of meteorological data obtained in various high-altitude zones of the Anmangynda basin. 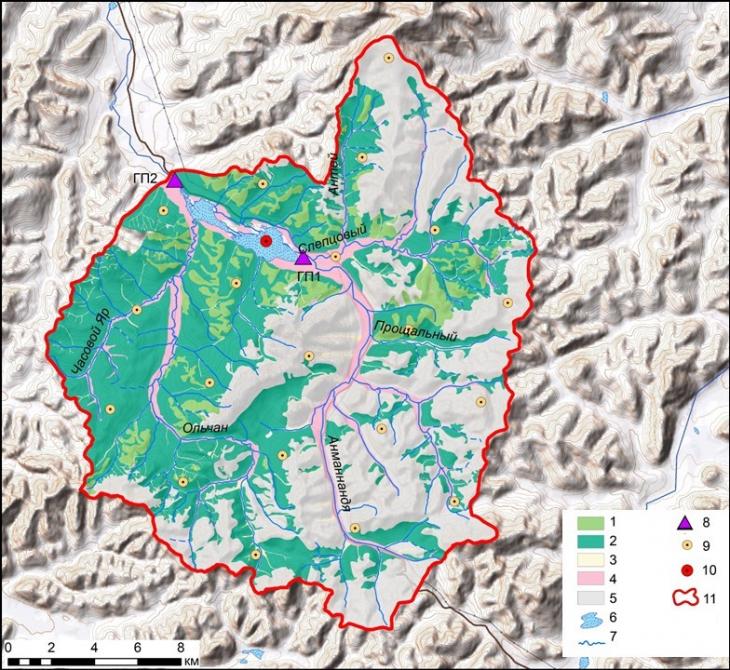
Fig. 4. The scheme of the catchment area of the Anmangynda river. Symbols: 1 — mountain tundra; 2 — mountain-slope; 3 — rare larch forest; 4 — river valley; 5 — stone scree; 6 — ice; 7 — river; 8 — hydrological post; 9 — settlement points; 10 — settlement point in the ice zone; 11 — basin boundary R. Anmangynda. Table 2. Materials used in the study. | Data | Post, data source | Data period, years | | Air temperature and humidity, precipitation | m/s Ust-Omchug | 1967-2022 | | Area, volume of ice | KUGMS reports [36] | 1963-1991 |
| Ice area | Satellite images | Landsat 1999–2022 Sentinel-2 2016–2022 | | Area, volume of ice | Unmanned aerial vehicle | 2021, 2022 | | Water flow and temperature | Closing gate (GP2) [29] | 1962-1987 | Results Continuous modeling of the flow of the Anmangynda River was carried out during the period of observations of the hydrological regime (1967-1987), which was used to assess the applicability of the Hydrograph model, as well as for 2000-2022 to trace possible changes in the region. The result of the simulation is the daily hydrographs of water runoff and the values of the elements of the water balance in the formation of the Anmangynda River, taking into account the ice runoff. In [33], the "Hydrograph" model has already been used for this object, but without the "Ice" block. Then the results showed that the average deviation of the calculated annual flow hydrograph from the observed one is 18%, and the Nash-Sutcliffe criterion (NS) varies from -0.94 to 0.72 in different years. When using the Ice block, the difference between the annual calculated and observed runoff layers averaged 36 mm or 13%. The median values of the NS criterion are on average 0.57, which is 0.16 higher than without using the "Ice" block (Table 3). Figure 5 shows an example of the result of calculating runoff using the "Hydrograph" model. The share of ice runoff during the high water period varied from 5 to 36%, and over the year — from 4 to 12% (from 15.4 to 31.1 mm). 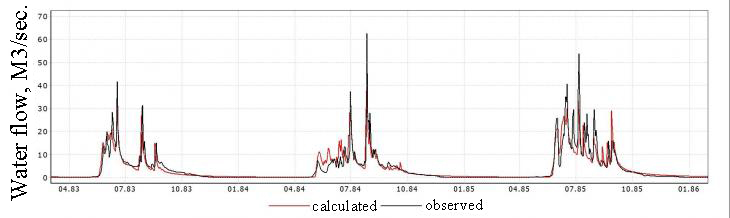
Fig. 5. Calculated and observed hydrographs of the flow of the Anmangynda river, 1983-1985. The maximum value of the NS criterion was 0.82 in 1983. The annual flow of the Anmangynda River during this period was 253 mm, the size of the ice was 5.2 km 2 and 7.2 million m3 in area and volume, respectively. Thus, the ice supply of the river for this year amounted to 19.1 mm or 7.6% of the river flow. Table 3. Annual water balance and modeling quality criteria in the Anmangynda river basin for the period 1966-1987. according to the author and the data of the dissertation work of N. V. Nesterova. | Parameter |
The authors' results | The results of N. V. Nesterova [33] | | Median | Average | MAX | MIN | Average | MAX | MIN | | Ys | 290 | 294 | 424 | 174 | 237 | | | | Yo |
274 | 290 | 459 | 163 | 290 | | | | P | 384 | 377 | 471 | 241 | 375 | | | | A | 19 |
20 | 31 | 14 | - | - | - | | E | 113 | 113 | 129 | 89 | 125 | | | | Ro | 33 | 36 | 107 |
2 | 53 | | | | Rs | 10 | 13 | 58 | 1 | 18 | | | | NS | 0.62 | 0.57 | 0.82 | -0.12 |
0.41 | 0.72 | -0.94 | | To | 0.81 | 0.80 | 0.92 | 0.49 | | | | Yo and Ys are the observed and calculated average annual annual runoff layer, mm; P is precipitation, mm; A is the ice runoff layer, mm; E is evaporation, mm; Ro and Rs are the deviation of the runoff value, in mm and %, respectively; NS is the Nash—Sutcliffe criterion (for daily values), b/r; K is the correlation coefficient (for daily values), b/r. In 1981, the share of ice runoff in the annual flow of the river was 22.7 mm (12.3%), and during the spring flood (May–June) — 19.2 mm or 33%. Figure 6 shows the role of ice in the formation of the flow of the Anmangynda River, so we note that in low-water years during high water and summer autumn, almost all runoff is the result of the destruction of ice. During the spring flood, icy waters flow over the river ice. 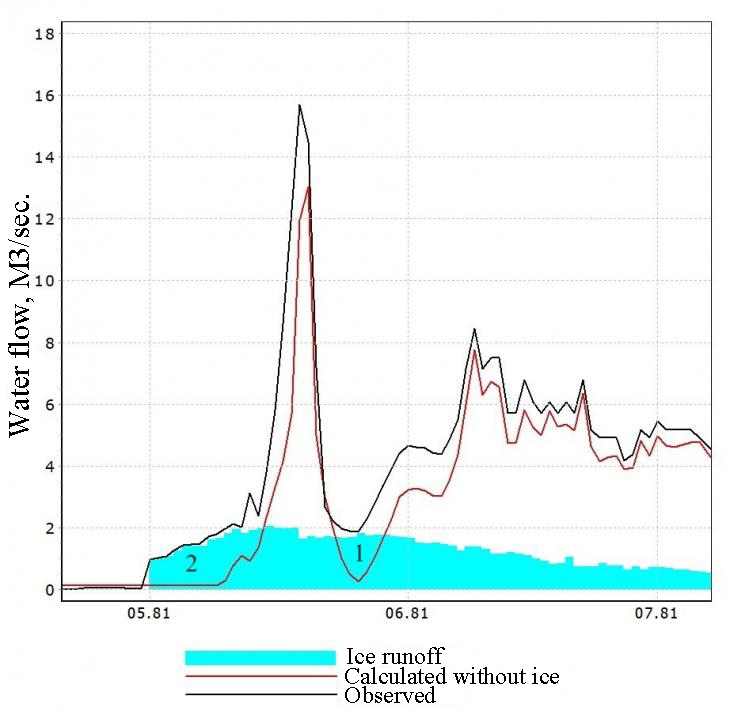
Fig. 6. Calculated total and ice runoff of the Anmangynda river during the high water period, 1981. Regions 1 and 2 — the share of ice runoff is almost 100%. For the modern period, using the example of 2016, it is also noted that the destruction of ice occurs earlier than river runoff is observed (Fig. 7). The river runoff layer this year was 251 mm, the contribution of ice to the annual flow of the river was 9%, and during the spring flood up to 19%. 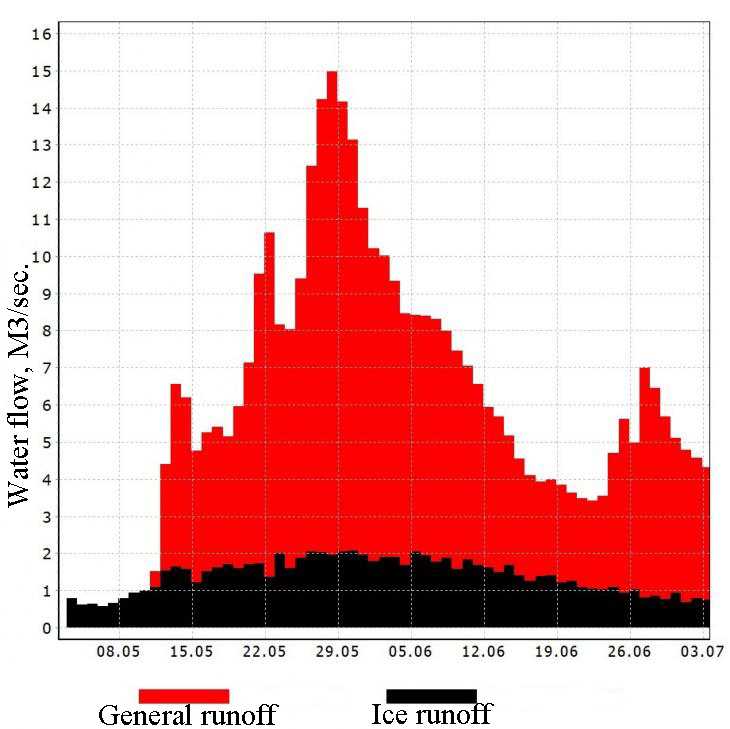
Fig. 7. Calculated total and glacial runoff of the Anmangynda river during high water, 2016
According to the Hydrograph model, there is a significant change in the values of the water balance of the Anmangynda River basin in 2000-2022 compared with the period 1967-1987. This may be due to the observed transformation of the hydrological regime of the rivers of the North-East of the country under the influence of climate warming [37]. It is noted that in the modern period, the annual flow of the Anmangynda River increased on average from 294 mm (1967-1987) to 353 mm (2000-2022), and the maximum and minimum values reached 600 and 251 mm (Table. 4), previously they were at the level of 459 and 163 mm (Table. 3), respectively. In particular, there is a decrease in the role of ice runoff in the formation of the water balance of the Anmangynda River. In 2000-2022, the amount of ice runoff varied from 13.4 to 22.6 mm, which amounted to 4 to 9% of the annual flow of the river, and during the spring flood, nutrition due to ice waters did not exceed 23%. Table 4.Calculated annual water balance (mm) in the Anmangynda river basin for the period 2000-2022 | | Median | Average | MAX | MIN | | Calculated drain, mm | 353 | 354 | 600 | 251 | | Precipitation, mm | 438 | 446 | 699 | 306 |
| Layer of ice runoff, mm | 20 | 20 | 28 | 13 | | Evaporation, mm | 117 | 117 | 134 | 97 | Conclusion The effect of ice on the natural environment has not yet been sufficiently studied due to the lack of long-term series of observations. For the same reason, methods for forecasting and accounting for ice in the water balance of rivers have not been developed, although on some rivers their contribution is comparable to glacial runoff. In this study, an algorithm for calculating ice runoff is proposed, which depends on the maximum size of the ice (before its melting), melting and evaporation coefficients, effective temperature and humidity deficiency, as well as the relative magnitude of the reduction in ice area over time. The algorithm was named the "Ice" block and was implemented into the "Hydrograph" model, which was repeatedly used to calculate the flow of rivers in the mountain cryolithozone, both provided and not provided with observational data. The expansion of the functionality of the Hydrograph model due to the introduction of a new Ice block made it possible to take into account the influence of ice phenomena on river flow in the daily interval, which is important for understanding the processes of water exchange in the cryolithozone. The algorithm was tested for R. Anmangynda. It was found that when using it, the error in calculating the annual flow of the river was 13%, having decreased by 5% (previously 18%). The Nash-Sutcliffe criterion improved and averaged 0.57 (previously 0.41). The results of numerical calculations carried out using the updated version of the Hydrograph model revealed changes in the contribution of the Anmangynda ice to the river flow in different periods. Thus, in 2000-2022, due to a reduction in the maximum size of ice and an increase in river runoff, there is a decrease in the influence of ice on runoff, which is important for understanding the dynamics of water resources in the cryolithozone. The proposed algorithm makes it possible to detail the water balance, which is important for more accurate calculations of hydrological characteristics and prediction of dangerous hydrological phenomena. Finally, it is worth noting that, despite the insignificant amount of ice runoff, its role in the ecosystem during the summer autumn in dry years can become critical. This circumstance underlines not only the importance of the conducted studies from the point of view of hydrology, but also their contribution to understanding ecological processes in regions where permafrost rocks are common. Nevertheless, a detailed understanding of the formation, distribution and influence of glaciers requires a comprehensive study, including data on the climate, hydrography and geology of a particular region. Thanks
The authors sincerely thank Denis Anatolyevich Revutsky, Head of the Tenkinsky Municipal District of the Magadan region, for his help in conducting research and ensuring the work of the scientific group in the district.
References
1. Morse P., Wolfe S. (2016). Long-Term River icing dynamics in discontinuous permafrost, subarctic Canadian Shield: River icing dynamics in discontinuous permafrost, subarctic Canada. Permafr. Periglac. Process. 28, pp. 580–586. https://doi.org/10.1002/ppp.1907.
2. Brombierstäudl D., Schmidt S., Nüsser M. (2021). Distribution and relevance of Aufeis (icing) in the upper Indus Basin. Science of The Total Environment., 780, p. 146604. https://doi.org/10.1016/j.scitotenv.2021.146604.
3. Alekseev V.R. (2016). Long-term variability of the spring taryn-aufeises. Ice and Snow, vol. 56, pp. 73–93. https://doi.org/10.15356/2076-6734-2016-1-73-92 [In Russian; abstract in English].
4. Glyatsiologicheskiy solvar’. Ed. V.M. Kotlyakov. Leningrad, Gidrometeoizdat. (1984). 528 p. [In Russian].
5. Morse P., Wolfe S. (2015). Geological and meteorological controls on icing (aufeis) dynamics (1985 to 2014) in subarctic Canada. Geophys. Res. Earth Surf. 120, P. 1670–1686. https://doi.org/10.1002/2015JF003534.
6. Makarieva O.M., Nesterova N.V., Alekseev V.R., Shikhov A.N., Zemlianskova A.A., Ostashov A.A. (2022). Estimation of Aufeis Resources in the Indigirka River Basin. Russ. Meteorol. Hydrol., 47, pp. 217–223. https://doi.org/10.3103/S1068373922030074
7. Romanovsky N.N. Groundwater of the cryolithozone. Edited by V.A. Vsevolozhsky. Moscow: Publishing House of Moscow State University. (1983). 232 p. [In Russian].
8. Alekseev V.R., Makarieva O.M., Shikhov A.N., Nesterova N.V., Ostashov A.A., Zemlyanskova A.A. (2021). Atlas of Giant Aufeis-Taryn of the North-East of Russia. SB RAS: Novosibirsk, Russia. 302 p. ISBN 978-5-6046428-2-5. (In Russian; abstract in English).
9. Piguzova V.M. (1965). Ocenka podzemnogo stoka v reki zony mnogoletnej merzloty. Tr. Gos. Gidrol. Inst. 122, 87–107. [In Russian].
10. Sokolov B.L. (1975). Naledi i rechnoj stok. Gidrometeoizdat: Leningrad, Russia. 190 p. [In Russian].
11. Markov M.L., Vasilenko N.G., Gurevich E.V. (2017). Naledi zony BAM: Ekspedicionnye issledovaniya. Saint Petersburg, Russia: Nestor-History. 320 p. [In Russian].
12. Brombierstäudl D., Schmidt S., Nüsser M. (2022). Spatial and temporal dynamics of aufeis in the Tso Moriri basin, eastern Ladakh, India. Permafrost and Periglacial Processes. 34, 10.1002/ppp.2173. https://doi.org/10.1002/ppp.2173.
13. Wanty R., Wang B., Vohden J., Day W., Gough L. (2007). Aufeis accumulations in stream bottoms in arctic and subarctic environments as a possible indicator of geologic structure: Chapter F in Recent U.S. Geological Survey studies in the Tintina Gold Province, Alaska, United States, and Yukon, Canada-results of a 5-year project. Scientific Investigations Report: 13 p.
14. Terry N., Grunewald E., Briggs M., Gooseff M., Huryn A.D., Kass M.A., Tape K.D., Hendrickson P., Lane Jr J.W., Hendrickson P., Lane J.W. (2020). Seasonal Subsurface Thaw Dynamics of an Aufeis Feature Inferred from Geophysical Methods. Journal of Geophysical Research: Earth Surface. 125(3). https://doi.org/10.1029/2019jf005345.
15. Seibert J., Vis M.J.P. (2012). Teaching hydrological modeling with a user-friendly catchment-runoff-model software package. Hydrol. Earth Syst. Sci. 16, pp. 3315–3325, https://doi.org/10.5194/hess-16-3315-2012.
16. Seibert J., Vis M., Lewis E., van Meerveld I. (2018). Upper and lower benchmarks in hydrological modeling. Hydrological Processes. 32. 10.1002/hyp.11476.
17. Koboltschnig G.R., Schöner W., Zappa M., Kroisleitner C., Holzmann H. (2008). Runoff modelling of the glacierized Alpine Upper Salzach basin (Austria): multi-criteria result validation. Hydrol. Process. 22, 3950–3964, https://doi.org/10.1002/hyp.7112.
18. Hülsmann L., Geyer T., Schweitzer C., Priess J., Karthe D. (2015). The effect of subarctic conditions on water resources: initial results and limitations of the SWAT model applied to the Kharaa River Basin in Northern Mongolia. Environmental Earth Sciences. 73(2), pp. 581–592. doi:10.1007/s12665-014-3173-1
19. Gagarin L., Qingbai W., Melnikov A., Volgusheva N., Tananaev N., Jin H., Zhang Z., Zhizhin V. (2020). Morphometric analysis of groundwater icings: Intercomparison of estimation techniques. Remote Sensing. 12(4), p. 692. doi:10.3390/rs12040692.
20. Makarieva O., Nesterova N., Ostashov A., Zemlyanskova A., Tumskoy V., Gagarin L., Ekaykin A., Shikhov A., Olenchenko V., Khristoforov I. (2021). Perspectives of the development of complex interdisciplinary hydrological and geocryological research in the North-East of Russia. Vestnik of SPbSU. Earth Sciences. 66(1). https://doi.org/10.21638/spbu07.2021.105.
21. Edemsky D.E., Tumskoy V.E., Prokopovich I.V. (2023). The first results of using georadar surveys to study the structure of aufeis in the valley of the Kyubyume river (Oymyakon highlands). Sbornik materialov konferencii Inzhenernaya i rudnaya geofizika. Petersburg, pp. 136-141. [In Russian].
22. Makarieva O., Nesterova N., Shikhov A., Zemlianskova A., Luo D., Ostashov A., Alexeev V. (2022). Giant Aufeis—Unknown Glaciation in North-Eastern Eurasia According to Landsat Images 2013–2019. Remote Sens. 14, pp. 4248. https://doi.org/10.3390/rs14174248.
23. Sokolov B.L., Sarkisyan V.O. (1981). Podzemnoe pitanie gornyh rek. Gidrometeoizdat: Leningrad, Russia, 239 p. [In Russian].
24. Tolstikhin O.N. (1974). Naledi i podzemnye vody severo-vostoka SSSR. Science: Novosibirsk, Russia, 164 p. [In Russian].
25. Bukaev N.A. (1969). Osnovnye zakonomernosti rezhima gigantskih naledej v verhov'yah r. Kolymy (na primere Anmangyndinskoj naledi). Naledi Sibiri. Moscow: Nauka. pp. 62–78. [In Russian].
26. Abramov D.A., Makarieva O.M., Zemlianskova A.A., Ostashov A.A., Nesterova N.V. (2023). Razvitie seti geokriologicheskogo monitoringa Magadanskoj oblasti: pervye rezul'taty 2021-2022 gg. Materialy V Vserossiyskoy nauchno-prakticheskoy konferentsii «Sovremennyye tendentsii i perspektivy razvitiya gidrometeorologii v Rossii». Irkutsk 23-25 November 2022 г. Ed. E.N. Sutyrina. Irkutsk. pp. 119-126. [In Russian].
27. Zemlianskova A., Alekseev V., Shikhov A., Ostashov A., Nesterova N., Makarieva O. (2023). Long-term dynamics of the huge Anmangynda aufeis in the North-East of Russia (1962–2021). Ice and Snow. 63 (1), pp. 71-84. https://doi.org/10.31857/S2076673423010167 [In Russian; abstract in English].
28. Zemlianskova A., Makarieva O., Shikhov A., Alekseev V., Nesterova N., Ostashov A. (2023). The impact of climate change on seasonal glaciation in the mountainous permafrost of North-Eastern Eurasia by the example of the giant Anmangynda aufeis. Catena. pp. 107530. https://doi.org/10.1016/j.catena.2023.107530
29. State Water Cadastre: Long-term data on the regime and resources of land surface waters: Volume 1. Issue 17. Basins of the Kolyma and Magadan region rivers. 1976–1980. Leningrad, Publ. Gidrometeoizdat. (1985). [In Russian].
30. Ostashov A.A., Makarieva O.M., Nesterova N.V., Zemlianskova A.A. (2022). Metodika monitoringa naledej s pomoshch'yu BPLA. Sbornik dokladov Shestoj konferencii geokriologov Rossii s uchastiem rossijskih i zarubezhnyh uchenyh, inzhenerov i specialistov. University Book House, Dobrosvet, Moscow. pp. 294-299. [In Russian].
31. Vinogradov Yu.B. (1988) Matematicheskoe modelirovanie processov formirovaniya stoka: opyt kriticheskogo analiza). Leningrad: Gidrometeoizdat. 312 p. [In Russian].
32. Lebedeva L.S. (2018). Formirovanie rechnogo stoka v zone mnogoletnej merzloty Vostochnoj Sibiri. Dis. Candidate of Geography Sciences. Moscow: Publishing House of the Institute of Geography of the Russian Academy of Sciences. 125 p. [In Russian].
33. Nesterova N.V. (2022). Modelirovanie gidrologicheskih harakteristik bassejnov gornyh rek Rossii razlichnoj stepeni izuchennosti v sovremennom klimate. Dis. ... candidate of Technical Sciences: 1.6.16. Saint-Petersburg. 177 p. [In Russian].
34. Vasiliev A.I. (2023). Current state of the landscapes in the catchment area of the Anmangynda River. Ustojchivost' prirodnyh i tekhnicheskih sistem kriolitozony v usloviyah izmeneniya klimata: materialy Vserossijskoj konferencii s mezhdunarodnym uchastiem, posvyashchennoj 150-letiyu M.I. Sumgina, Yakutsk, Russia, 22–24 March 2023. pp. 182–186. [In Russian].
35. Makarieva O., Nesterova N., Lebedeva L., Vinogradova T. (2019). Modeling runoff formation processes in the high-mountain permafrost zone of Eastern Siberia (a case study of the Suntar-Khayata Range). Geography and Natural Resources. 1, pp. 178–186, https://doi.org/10.21782/GiPR0206-1619-2019-1(178-186). [In Russian; abstract in English].
36. Otchet po rezul'tatam vodnobalansovyh issledovanij s nalednoj sostavlyayushchej v bassejne r. Anmangyndy. Magadan: KUGMS. (1977). 62. [In Russian].
37. Makarieva O.M.; Nesterova N.V.; Post D.A.; Sherstyukov A.; Lebedeva L. (2019). Warming temperatures are impacting the hydrometeorological regime of Russian rivers in the zone of continuous permafrost. Cryosphere. 13, pp. 1635–1659
Peer Review
Peer reviewers' evaluations remain confidential and are not disclosed to the public. Only external reviews, authorized for publication by the article's author(s), are made public. Typically, these final reviews are conducted after the manuscript's revision. Adhering to our double-blind review policy, the reviewer's identity is kept confidential.
The list of publisher reviewers can be found here.
The subject of the study, according to the author, is the forecast of hydrological processes and modeling of the processes of river flow formation in the mountainous cryolithozone of northeastern Russia with ice nutrition on the example of the Anmangynda River (flows into the Detrin River, a tributary of the Kolyma River). The methodology of the research is indicated in the article as the analysis of historical data using analytical methods of information about the hydrological regime based on the work of the materials of the Kolyma department of the hydrometeorological service, collection, digitization and analysis over a thirty-year period, the use of maps, literary data and stock materials. From the analysis of the article, it can be concluded that methods for estimating the modern ice area are used based on the analysis of satellite images of Landsa satellites over a twenty-year period, statistical analysis, climatological analysis with the construction of links between meteorological characteristics and the intensity of hydrological processes. The relevance of the topic raised is unconditional and consists in obtaining information about ice as a specific form of seasonal glaciation, characteristic of the mountain conditions of permafrost, being a key element in the chain of water exchange processes, the permafrost distribution zone forms 50-90% of ice runoff into river runoff in May-June, in July the share reaches 30%, and in August - up to 7%. The hydrological role of glaciers in the formation of river runoff can be comparable to such snow and ice phenomena as glaciers. In this regard, the study of the nutrition regime in particular and the hydrological regime in general, depending on the conditions of formation, deposition and melting of ice, is an important aspect of understanding the geoecological mechanism of hydrological dynamic processes. The research of the author of the article helps to solve the problem of developing a mathematical apparatus that allows predicting the size and nature of ice processes, as well as taking into account their impact on river flow and other components of the natural environment lies in the fact that there is no state program for studying ice. The scientific novelty lies in the attempt of the author of the article on the basis of the conducted research and the dynamics of the maximum size of ice and an increase in river runoff with a decrease in the influence of ice on runoff as important for understanding the dynamics of water resources in the cryolithozone. This is an important addition in the development of geocryology. Style, structure, content the style of presentation of the results is quite scientific. The article is provided with rich illustrative material reflecting the process of cartographic modeling. The article is illustrated with visualized forms of maps and photographs. The bibliography is very comprehensive for the formulation of the issue under consideration, but does not contain references to normative legal acts and methodological recommendations on the geochemical analysis of soil features. The appeal to the opponents is presented in identifying the problem at the level of available information obtained by the author as a result of the analysis. Conclusions, the interest of the readership in the conclusions there are generalizations that made it possible to apply the results obtained. The target group of information consumers is not specified in the article.
Link to this article
You can simply select and copy link from below text field.
|
|